Figures & data
Table 1. Characteristics of the 33 patients who underwent USgHIFU, and mean volumes before treatment.
Table 2. Clinical parameters included in the UFS-QOL [Citation11].
Figure 1. Plain US images collected (A) before and (B) after HIFU treatment show the difference in fibroid ecogenicity. In (B) disomogeneous hyperchoic changes of treated fibroid are visible.
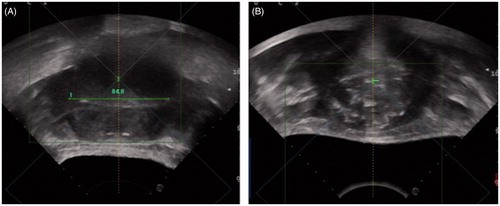
Figure 2. CEUS imaging before (A) and after (B) USgHIFU of 48 mm highly perfused uterine fibroma (*). In (B) CEUS shows a complete devascularisation of the treated fibroma. Arrow = left common femoral vein; arrowhead = bowel loop.
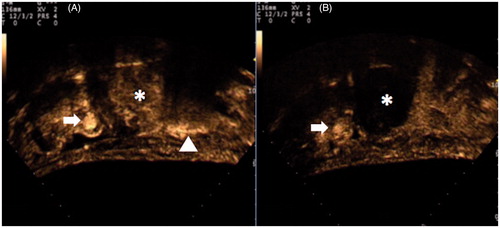
Figure 3. CEUS imaging during USgHIFU of a 75-mm highly perfused uterine fibroma shows a still highly perfused tissue (arrowheads) around the central, already treated, devascularised area (*).
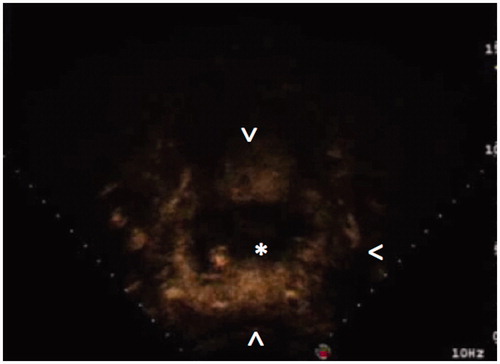
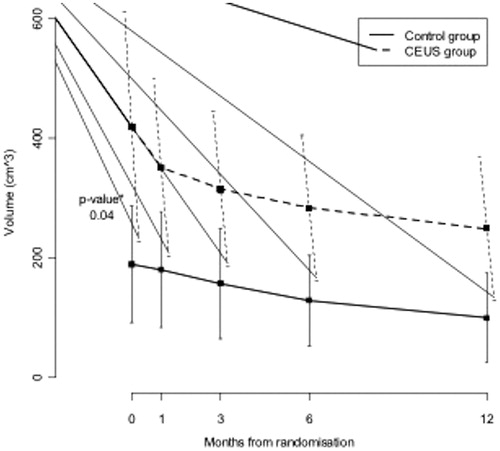
Figure 4. Fibroid volume changes and their confidence interval for both randomisation groups.