Figures & data
Table 1. The materials needed for production of nanoparticles at different synthesis stages.
Figure 1. Schematic of the synthesis method and expected mechanism of drug release from the core-shell nanostructure. Rapid melting of protective shell provides preferred trajectories for drug release.
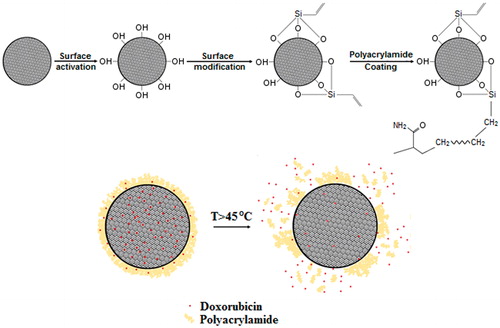
Figure 2. The FT-IR spectra of the particles at different synthesis stages. (a) mesoporous silica (MSN), (b) activated mesoporous silica (AMSN), (c) vinyl-functionalised mesoporous silica (VMSN), and (d) polyacrylamide-coated mesoporous silica (PMSN).
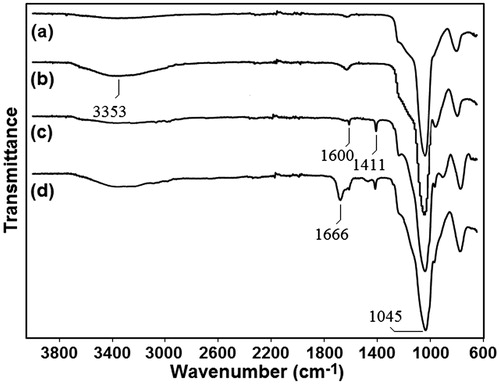
Figure 3. Microstructural images of synthesised nanoparticles. (a, c, e) SEM, and (b, d, f) TEM images of the specimens with AA/MSN weight ratios of 0.5, 1.0, and 1.5, respectively.
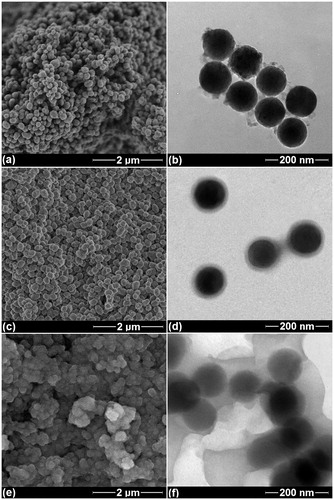
Figure 4. The thermal behaviour of core-shell nanoparticles. (a) The TGA, and (b) the DSC analysis of a typical specimen with AA/MSN weight ratio of 1.0.
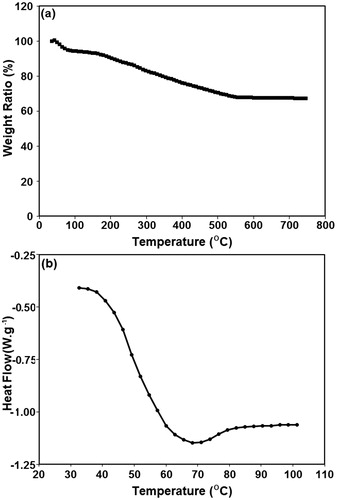
Figure 5. The amount of doxorubicin encapsulated in nanoparticles at different time intervals. (a) UV-Vis spectra of PMSNs after incubation in doxorubicin solution for 0, 24, 48, and 72 h; (b) the amount of doxorubicin encapsulated in the particles at different incubation times.
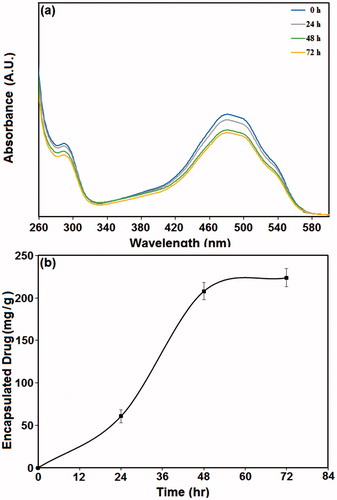
Figure 6. The ratio of doxorubicin released at different temperatures. (a) UV-Vis spectra of S10 specimens heated at 37, 50, and 60 °C. (b) The percentage of drug release from the PMSNs after heating at various temperatures for a period of 30 min.
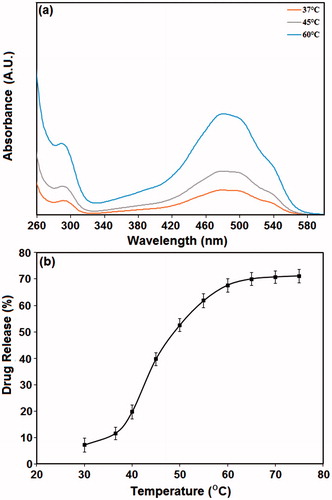
Figure 7. (a) TEM image of PMSNs after heating at 60 °C. The PAA shell is partially removed because of melting at this temperature range. (b, c) AFM image of PMSNs before, and after heating at 60 °C, respectively.
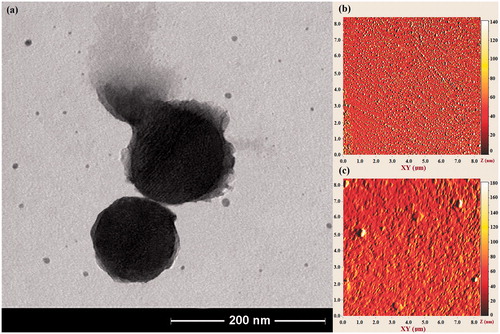
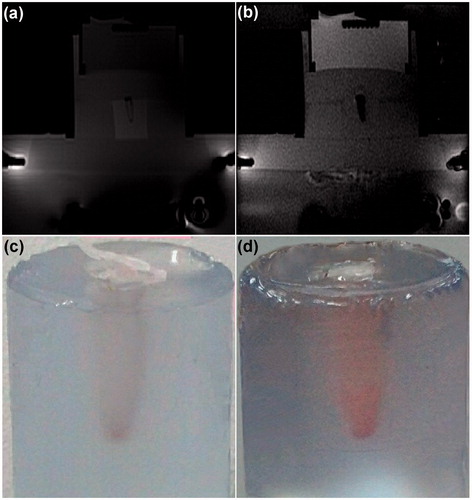
Figure 8. The procedure applied for MRgFUS sonication of nanoparticles. (a–c) Magnetic resonance phase images of a typical thermosensitive phantom containing drug-loaded PMSNs during MRgFUS heating. (d–g) The temperature patterns obtained during the heating process, where higher temperatures are shown in red. (h) The temperature plot of the focal point during sonication of the phantom.
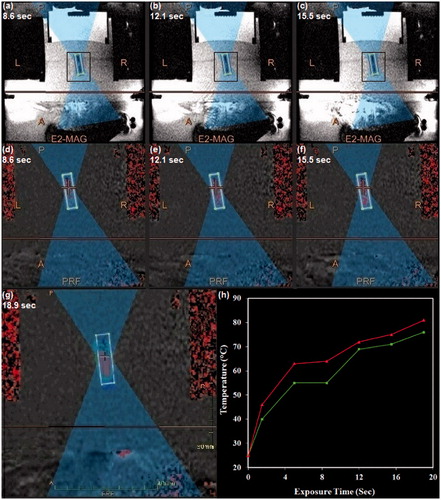
Figure 9. Influence of MRgFUS sonication on drug-loaded nanoparticles. (a, b) Magnetic resonance phase images of a typical thermosensitive phantom containing drug-loaded PMSNs before and after MRgFUS treatment, respectively. (c, d) The colour change of the aqueous solution containing drug-loaded PMSNs after MRgFUS treatment, confirming the partial release of encapsulated drug.