Figures & data
Table 1. SAR-wb, T-max, CEM43 and thermal damage in porcine muscle.
Figure 1. Qualitative comparison of macroscopic (A) and microscopic (B) thermal damage. Note the sharp transition from damaged tissue (pale area in A) to normal tissue (dark/red area in A). In A, the temperature probe is positioned within the pale damaged tissue. The damage turns out to be severe in nature, characterised by burn blister, which separates subcutaneous fat from muscle. In B, the frozen section stained with H&E shows a sharp interface between the normal muscle tissue in the lower right part of the picture and the widening of the extracellular space in the thermally damaged upper left part of the picture.
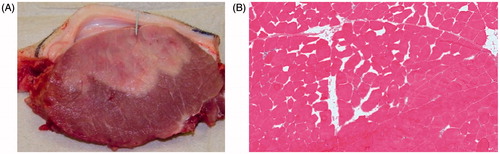
Figure 2. Morphology of thermal damage (B, D, F) in comparison to undamaged muscle (A, C, E). (A) Physiological structure of undamaged muscle stained with H&E (100×). (B) Widening of intercellular spaces in damaged muscle areas (100×). (C) Strong Periodic acid Schiff (PAS) signal in undamaged myocytes (100×). (D) Loss of PAS reaction in damaged myocytes (100×). (E) Strong myophosphorylase activity in undamaged myocytes (200×). (F) Loss of myophosphorylase activity in the damaged area (200×). Note that in A, C and E generally no extracellular space is visible and the cellular structure is well preserved. In contrast, in B, D and F the extracellular space is widened.
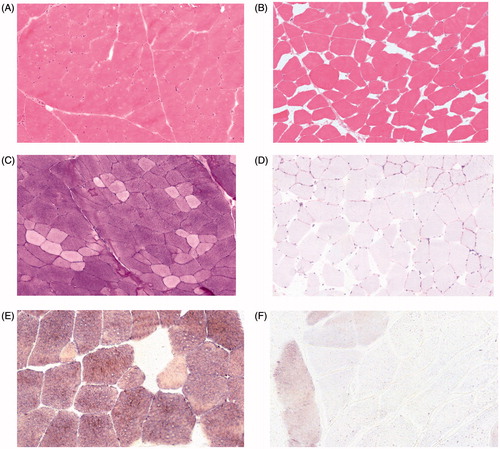
Figure 3. Relationship between SAR-wb and thermal damage in all animals for sensor 1 in longissimus dorsi (A), for sensor 2 in obliquus externus and obliquus internus (B), and for sensor 3 in biceps femoris (C). A very weak correlation is observed and no clear tissue damage thresholds can be specified for SAR-wb. Note that catheters for sensors 1 and 3 were placed perpendicular to the skin surface, and the catheter for sensor 2 was placed parallel to the skin surface.
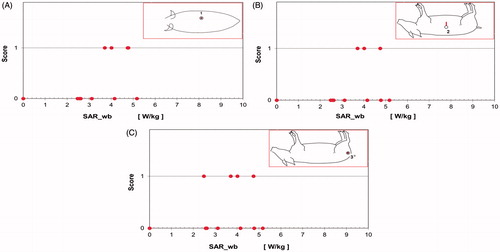
Figure 4. (A) Relationship between T-max and thermal damage for all animals for sensor 1. For values of T-max ≤45.5 °C, no thermal muscle damage is present. Values of T-max ≥45.9 °C are always associated with thermal muscle damage. (B) Relationship between T-max and tissue damage for sensor 2. For values of T-max ≤44.4 °C, no thermal muscle damage is present. Values of T-max ≥46.4 °C are always associated with thermal muscle damage. (C) Relationship between T-max and tissue damage for sensor 3. Here, for values of T-max ≤40.3 °C, no thermal muscle damage is present. Values of T-max ≥41.3 °C are always associated with thermal muscle damage. Overall, a good correlation is observed between T-max and tissue damage.
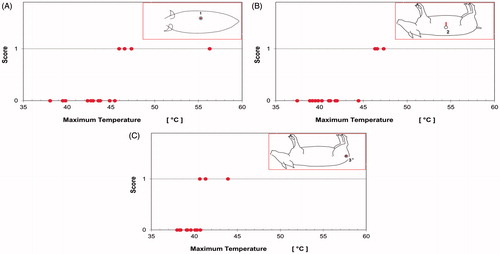
Figure 5. (A) Relationship between CEM43 and thermal damage for sensor 1. For values of CEM43 ≤68.1 min, no thermal muscle damage is present. Values of CEM43 ≥188 min are always associated with thermal muscle damage. (B) Relationship between CEM43 and thermal damage for sensor 2. For values of CEM43 ≤67 min no thermal muscle damage is present. Values of CEM43 ≥235 min are always associated with thermal muscle damage. (C) Relationship between CEM 43 °C and thermal damage for sensor 3. For values of CEM43 ≤1.1 min no thermal muscle damage is present. Values of CEM43 ≥2.7 min are always associated with thermal muscle damage.
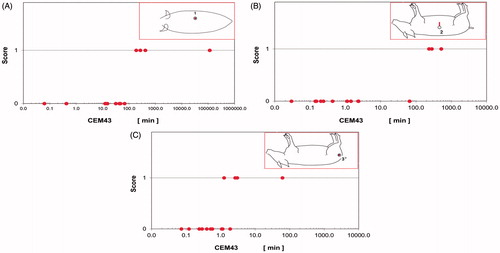
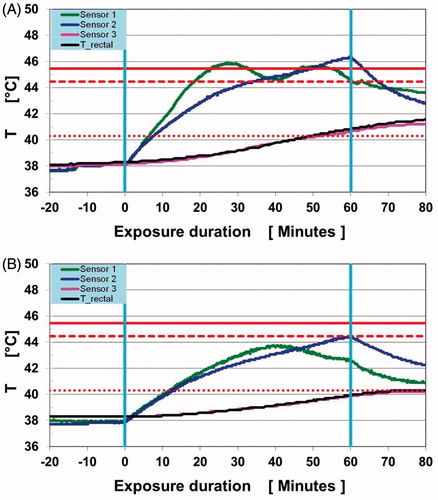
Figure 6. Sensor temperatures for pig 12 (A) and 6 (B) versus time, during RF irradiation in the MR body coil, for sensors 1 (green line), 2 (blue line), 3 (purple line), and R (rectal, black line). Two lower thresholds are displayed as horizontal red lines: T-low = 45.5 °C for sensor1 (solid line), T-low = 44.4 °C for sensor 2 (dashed line). Also, the lower damage-related value T-low = 40.3 °C for sensor 3 (dotted line) is displayed. The time scales on the abscissa axes are arranged so that the start and the end of the RF irradiation are at 0 and 60 min, respectively (both values are marked by light blue vertical lines). Note that temperatures for sensors 3 and R (rectal) are almost identical.