
Figures & data
Figure 1. Schematic of HIFU-induced effects. (A) Thermal elevation is proportional to tissue absorption and time average intensity, occurring preferentially within the transducer focal region. This can ablate vessels. (B) Flow within fluid (e.g. blood) is induced by acoustic streaming, which occurs as a result of momentum imparted by the ultrasound wave to the propagating medium. (C) In tissue, radiation force induces displacements in the direction of ultrasound propagation – a phenomenon that can displace blood vessel walls. (D) At sufficiently high peak negative pressures, cavitation can be induced – leading to a spectrum of vascular effects such as haemorrhage or the formation of thrombus.
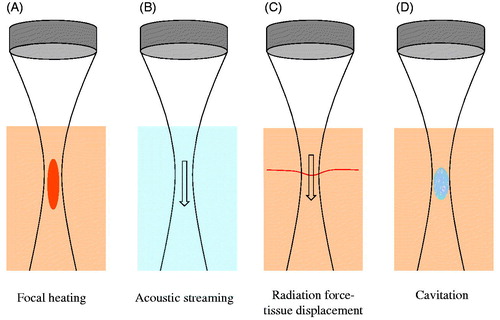
Figure 2. Schematic of several ultrasound-stimulated microbubble behaviours of relevance to inducing vascular bioeffects. (A) Microbubble adjacent to a vessel wall (left) undergoes expansion that deforms the wall outwards and creates fluid flow patterns that give rise to shear stress at the lumen surface endothelial cells (middle). During rarefaction, the fluid flow patterns change and there can potentially be an invagination of the wall. (B) Hydrodynamic jets have been reported that are directed towards the vessel wall. (C) Bubbles can undergo inertial collapse, a violent process that can result in extremely high local temperatures, shock waves, and the release of reactive oxygen species.
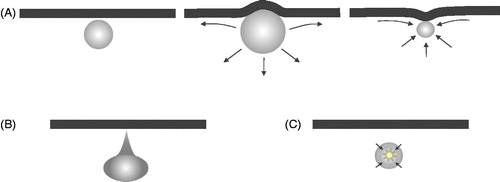
Figure 3. Figure illustrating vascular shutdown in a subcutaneous mouse tumour by ultrasound-stimulated microbubbles. (A) Example ultrasound contrast images at peak enhancement following microbubble injection prior to treatment (left) and after therapy exposures (right). These images illustrate qualitatively the reduction of perfusion resulting from the treatment, which preferentially affects the central regions of the tumour. Images are 1.5 cm lateral dimension. (B) An example of time–intensity contrast curves (central and peripheral regions of interest) following the bolus injection of contrast for a tumour during treatment. After an initial a rise to a peak as microbubbles enter the tumour, there is a gradual decay over several minutes which is associated with a systemic reduction in microbubble concentration in the bloodstream. Therapy pulses of 1 MHz (1.6 MPa peak negative pressure) are sent every 20 s, resulting in the destruction of agent within the tumour. In the peripheral region, substantial reperfusion occurs following each burst; however, in the central region there is a reduced level of reperfusion with successive burst, consistent with a reduction in blood flow in response to the treatment. (C) Example cavitation signals recorded from the microbubbles within the tumour during exposure to therapy pulses, expressed as a function of frequency in a decibel scale. The ‘baseline’ signal (solid) is taken prior to microbubble injection and arises from scattering of the incident US by tissue. Here a clear 1 MHz component (transmit frequency) along with a 2 MHz signal associated with (non-linear) propagation of the US pulse. Signals outside these frequencies are associated primarily with noise. For the microbubble signals (dashed) there are also pronounced peaks at 0.5 (subharmonic) and 1.5 MHz (ultraharmonic). The remaining substantial energy present across a wide range of frequencies is a hallmark of inertial cavitation, indicating the violent oscillations of microbubbles during the therapy pulses. Figure from Todorova et al. [Citation128].
![Figure 3. Figure illustrating vascular shutdown in a subcutaneous mouse tumour by ultrasound-stimulated microbubbles. (A) Example ultrasound contrast images at peak enhancement following microbubble injection prior to treatment (left) and after therapy exposures (right). These images illustrate qualitatively the reduction of perfusion resulting from the treatment, which preferentially affects the central regions of the tumour. Images are 1.5 cm lateral dimension. (B) An example of time–intensity contrast curves (central and peripheral regions of interest) following the bolus injection of contrast for a tumour during treatment. After an initial a rise to a peak as microbubbles enter the tumour, there is a gradual decay over several minutes which is associated with a systemic reduction in microbubble concentration in the bloodstream. Therapy pulses of 1 MHz (1.6 MPa peak negative pressure) are sent every 20 s, resulting in the destruction of agent within the tumour. In the peripheral region, substantial reperfusion occurs following each burst; however, in the central region there is a reduced level of reperfusion with successive burst, consistent with a reduction in blood flow in response to the treatment. (C) Example cavitation signals recorded from the microbubbles within the tumour during exposure to therapy pulses, expressed as a function of frequency in a decibel scale. The ‘baseline’ signal (solid) is taken prior to microbubble injection and arises from scattering of the incident US by tissue. Here a clear 1 MHz component (transmit frequency) along with a 2 MHz signal associated with (non-linear) propagation of the US pulse. Signals outside these frequencies are associated primarily with noise. For the microbubble signals (dashed) there are also pronounced peaks at 0.5 (subharmonic) and 1.5 MHz (ultraharmonic). The remaining substantial energy present across a wide range of frequencies is a hallmark of inertial cavitation, indicating the violent oscillations of microbubbles during the therapy pulses. Figure from Todorova et al. [Citation128].](/cms/asset/4a0a8c99-12cd-4e3d-bd20-40e0d82fe91c/ihyt_a_1009179_f0003_c.jpg)