
Figures & data
Figure 1. Set-up of ex vivo sample using ‘gold standard’ MR-compatible fluoroptic temperature sensors. (A) Perforating needles inserted into the ribs. (B) Optical fibres (numbered 1 to 4) inserted into the medullar cavity ‘tunnel’. (C) Transverse oblique section in the T1w 3D MR data visualising tagged ‘tunnel’ (see red arrow) in which the fluoroptic sensor was positioned. Note the dotted white line indicating the position of the sagittal slice for MR thermometry tangent to the tip of the tunnel. The location of the fluoroptic probe measurement (the tip of the probe) is identified with red ‘x’ symbol. (D) Sagittal section in the T1w 3D MR data visualising the orthogonal section of the ribs (see dotted yellow ellipses), which were positioned in the pre-focal HIFU zone. (E) Similar to C, but an external mask (white arrow) is visible below the imaged rib, for acoustic shielding. (F) Curved interpolated slice reconstructed from the T1w 3D MR data for a pseudo-planar representation of the thoracic wall and the rib cage. (G) Gradient echo FLASH 2D image orthogonal to the ribs, illustrating the protector (see white arrow indicating the signal void area) aligned using a conical projection from the focal point. Fields of view shown are 128 × 128 mm2 (C), 140 × 140 mm2 (D) with zoom-in insert box by a factor of 2, and 220 × 110 mm2 (G).
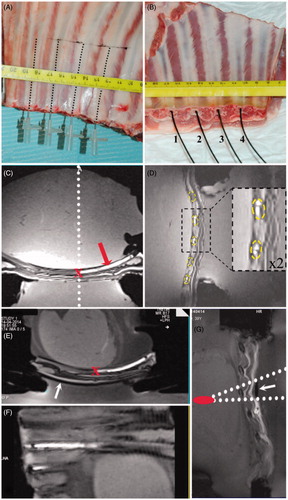
Table 1. Overview of the experimental results. The distance from the rib’s central axis to the focus was 3.5 cm (A and B), 6.5 cm (C) and 5.5 cm (D).
Figure 2. In vitro investigation of thermal build-up around a 10-mm diameter PE tube filled with degassed water, embedded in PAAM gel and positioned in the pre-focal HIFU zone at 5 cm below the focus. Sagittal (A) and transversal (B) views of the PE tube are illustrated. Overlaid drawings indicate the HIFU beam cone and the focal point position for the set-up. The temperature elevation map colour code ranges from +4° to +30 °C.
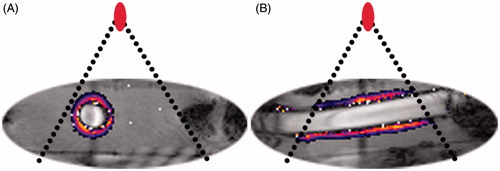
Figure 3. Temperature elevation maps illustrating the end point of the HIFU sonication in three different experiments (one per row), with PRFS data overlaid on GRE-EPI magnitude images. The acoustic power and duration were respectively (A–D) 70.3 W, 30 s, (E–H) 180 W, 30 s, (I–L) 137.8 W, 60 s. A low energy pilot sonication is shown in frames A–C, used for confirming the alignment of the slices. The definition of the external and internal rib facets is illustrated in frame D where the elliptical focal shape is also drawn. Frames A and E show transverse slices passing between two ‘central’ ribs and frame I is a transverse-oblique slice passing through a sonicated rib. Frames H and L are zoom-in of frames F and J, respectively, by a factor of 3, demonstrating the symmetry of the thermal build-up around the heated ribs. Note in frame H the locations of the time temperature profiles that are further plotted in : internal facet ΔT(I) and external facet ΔT(E)). In frames F and H one rib proximal to the acoustic beam axis was protected with external shielding. White arrows indicate the incidence direction of the HIFU beam. The temperature colour bar is provided in the right column, one per row. The field of view of the frames shown excluding the last column is 128 mm2.
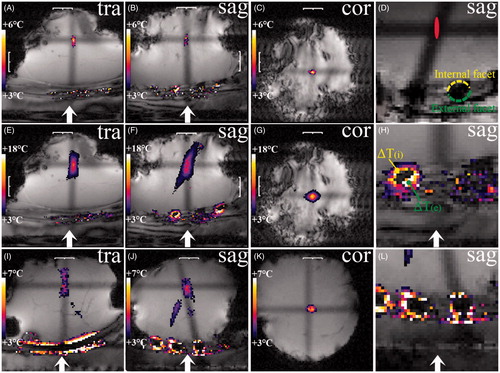
Figure 4. Plots of the temperature elevation measured at the focal point (red), at the external (blue) and internal (green) facets of the rib using MRT, and inside the medullar cavity of the rib using the fluoroptic sensor (black), for various measurement conditions. The sonication acoustic power and duration parameters were, respectively, (A) 180 W, 30 s; (B) 180 W, 30 s, (C)137.8 W, 30 s, (D) 137.8 W, 60 s. External shielding of one rib is indicated in (A) see dotted line, and all other curves plotted with continuous line were recorded for unprotected ribs. The black arrow in A indicates a discontinuation of the first order temporal derivative of the thermal relaxation curve inside a shielded rib.
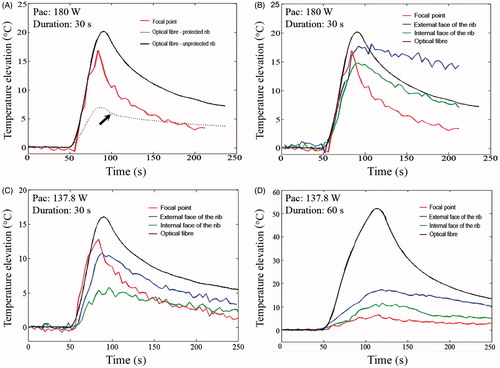
Figure 5. Illustration of 1D profiles of the thermal build-up through unprotected ribs in different experiments, along a direction perpendicular to the propagation axis of the HIFU beam and corresponding to the sonication end point: (A) 30 s, and (B) 60 s. The perpendicular section of the rib is qualitatively illustrated. *Pericostal temperature elevation data are obtained from PRFS thermometry in the axial plane. The blue ‘o’ denotes where the highest point of the Gaussian fit was constrained according to the intra-medullar fluoroptic sensor data.
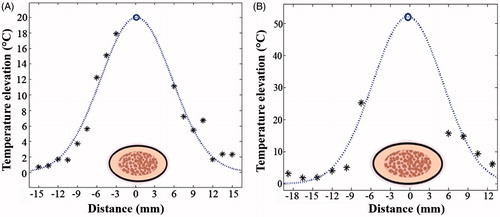
Figure 6. Experimental plot of the left hand side of Equation 8 as a function of the post-sonication time lapse (Δt). Fluoroptic sensor data during thermal relaxation inside the unprotected rib was obtained in the same experiment as shown in . The dotted line corresponds to the slope at the origin expressed in Equation [9].
![Figure 6. Experimental plot of the left hand side of Equation 8 as a function of the post-sonication time lapse (Δt). Fluoroptic sensor data during thermal relaxation inside the unprotected rib was obtained in the same experiment as shown in Figure 5(A). The dotted line corresponds to the slope at the origin expressed in Equation [9].](/cms/asset/616f9977-669e-4ba4-ae49-c369d0c4afa6/ihyt_a_1009501_f0006_c.jpg)