851
Views
12
CrossRef citations to date
0
Altmetric
Research Article

Genomic profiling in locally advanced and inflammatory breast cancer and its link to DCE-MRI and overall survival

, , , , , , , & show all
Pages 386-395 | Received 12 Dec 2014, Accepted 04 Feb 2015, Published online: 26 Mar 2015

Figures & data

Figure 1. Wash-in parameter (WiP) maps generated from DCE-MRI in LABC patients. WiP maps are surrogates for perfusion/permeability [Citation7]. The right image shows the CF enhancement pattern which is a uniform enhancement from centre to periphery. The left image is the CP enhancement pattern which is an inhomogeneous ring-type enhancement. The 10–250 scale represents the range of the WiP as previously described in detail [Citation7].

Figure 1. Wash-in parameter (WiP) maps generated from DCE-MRI in LABC patients. WiP maps are surrogates for perfusion/permeability [Citation7]. The right image shows the CF enhancement pattern which is a uniform enhancement from centre to periphery. The left image is the CP enhancement pattern which is an inhomogeneous ring-type enhancement. The 10–250 scale represents the range of the WiP as previously described in detail [Citation7].

Figure 2. Heat map cluster plot of Affymetrix microarray data in LABC samples. This heat map plot records post-normalisation between-probes distances measured by their absolute median difference. The left diagram represents all the top probe sets associated with144 genes, which were differentially expressed in CF versus CP (p < 0.008); 80% of the probes had higher expression levels in the CP enhancement pattern and only 20% had higher expression levels in CF. The right diagram is the enlarged heat map for MTA1, PARP6, SULT1A1 and SULT1A2. In the table, test statistic (teststat) is the smaller of two sums of ranks of given sign. Negative test statistics represent higher expression level of a gene in the CF pattern, and positive test statistics represent higher expression level in the CP perfusion pattern.

Figure 2. Heat map cluster plot of Affymetrix microarray data in LABC samples. This heat map plot records post-normalisation between-probes distances measured by their absolute median difference. The left diagram represents all the top probe sets associated with144 genes, which were differentially expressed in CF versus CP (p < 0.008); 80% of the probes had higher expression levels in the CP enhancement pattern and only 20% had higher expression levels in CF. The right diagram is the enlarged heat map for MTA1, PARP6, SULT1A1 and SULT1A2. In the table, test statistic (teststat) is the smaller of two sums of ranks of given sign. Negative test statistics represent higher expression level of a gene in the CF pattern, and positive test statistics represent higher expression level in the CP perfusion pattern.

Figure 3. Differential expression levels in the CF enhancement pattern compared to the CP. (A and B) Our analysis demonstrates an overexpression of SULTs (SULT1A1 and SULT1A2) in the CP enhancement compare to CF. (C) The CP enhancement pattern is associated with higher expression levels of PARP6. (D) MTA1 shows higher expression levels in the CF enhancement pattern compared to the CP.

Figure 3. Differential expression levels in the CF enhancement pattern compared to the CP. (A and B) Our analysis demonstrates an overexpression of SULTs (SULT1A1 and SULT1A2) in the CP enhancement compare to CF. (C) The CP enhancement pattern is associated with higher expression levels of PARP6. (D) MTA1 shows higher expression levels in the CF enhancement pattern compared to the CP.

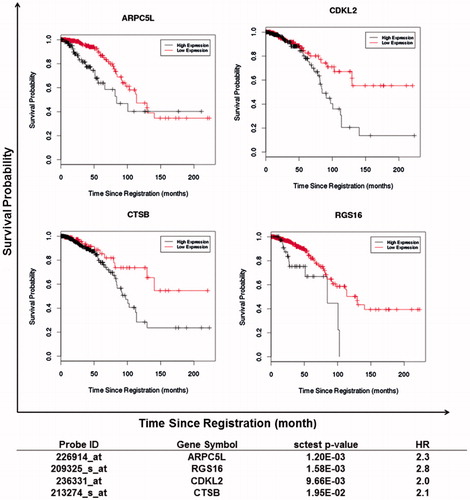
Table 1. Association between gene expression patterns and overall survival in IBC patients.

Figure 4. Gene expression patterns and overall survival in IBC patients. ARPC5L and CDKL2 expression levels are significantly associated with long-term OS in IBC patients. Survival time represents years. Three of the patients from the Duke clinical trial who are alive are represented with a triangle symbol in the graph.

Figure 4. Gene expression patterns and overall survival in IBC patients. ARPC5L and CDKL2 expression levels are significantly associated with long-term OS in IBC patients. Survival time represents years. Three of the patients from the Duke clinical trial who are alive are represented with a triangle symbol in the graph.

Figure 5. External confirmation for gene expression patterns and overall survival in LABC using TCGA database. In TCGA LABC cohort differential expression of four genes exhibited the same significant concordance and association with overall survival as in the IBC patients. The black lines in the graph represent high expression levels and the red lines represent low expression levels of the genes. The “sctest p-value” and “HR” (which is a cox HR) columns are based on the log rank test.

Figure 5. External confirmation for gene expression patterns and overall survival in LABC using TCGA database. In TCGA LABC cohort differential expression of four genes exhibited the same significant concordance and association with overall survival as in the IBC patients. The black lines in the graph represent high expression levels and the red lines represent low expression levels of the genes. The “sctest p-value” and “HR” (which is a cox HR) columns are based on the log rank test.

Table 2. Overview of some of the biological processes associated with differential expression of our genes of interest.

Reprints and Corporate Permissions

Please note: Selecting permissions does not provide access to the full text of the article, please see our help page How do I view content?

To request a reprint or corporate permissions for this article, please click on the relevant link below:

Academic Permissions

Please note: Selecting permissions does not provide access to the full text of the article, please see our help page How do I view content?

Obtain permissions instantly via Rightslink by clicking on the button below:

If you are unable to obtain permissions via Rightslink, please complete and submit this Permissions form. For more information, please visit our Permissions help page.