Figures & data
Figure 1. Kaplan-Meiersurvival curves illustrating 30 days survival of 200 -g Wistar male and female rats subjected to 9-Gy whole body gamma irradiation and treated with partial body hyperthermia (PBH) 20 h prior to irradiation. According to Log-rank (Mantel-Cox) test, control vs. 9 Gy male, p < 0.0001; control vs. 9 Gy female, p < 0.0001; 9 Gy 200g male vs. PBH male, p < 0.001; 9 Gy 200g female vs. PBH female, p < 0.001.
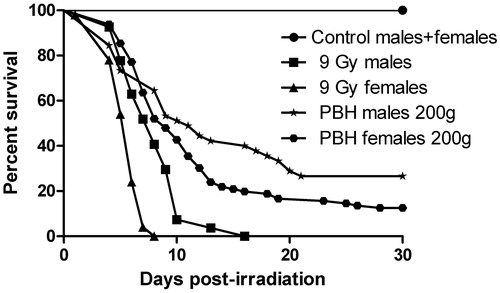
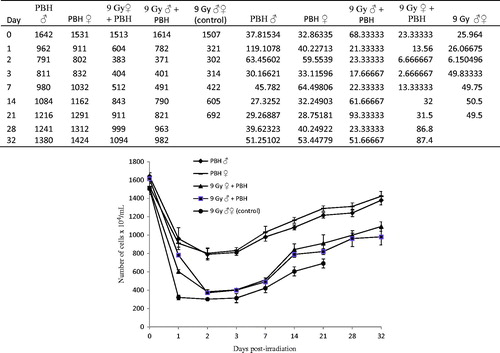
Table 1. Time-mortality responses of Wistar male and female rats subjected to 9 Gy whole body gamma irradiation and treated with partial body hyperthermia (PBH) 20 h prior to irradiation.
Figure 2. Recovery of bone marrow cells of Wistar male and female rats subjected to 9-Gy whole body gamma irradiation and treated with partial body hyperthermia (PBH) 20 h prior to irradiation. Error bars represent the mean ± SEM. Significant differences were found between treatments on day 21 post-irradiation (F = 1936; df = 4, 70; p < 0.0001), ANOVA followed by PLSD.