Figures & data
Figure 1. Clonogenic survival curves for MMR-deficient (HCT116 + ch2) and MMR-proficient (HCT116 + ch3) colon cancer cells exposed to cisplatin (cPt) and hyperthermia + cisplatin (H+cPt). (A) MMR- cells and (B) MMR+ cells treated with cPt for 1 h (closed squares) or treated with cPt 24 h after 42 °C hyperthermia (closed triangles). Each point represents the mean ± SEM of three experiments performed in duplicate.
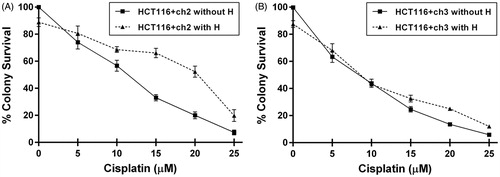
Figure 2. MLH1 and MSH2 colocalise with Hsp27 and Hsp72 in HCT116+ch3 (MMR+) and HCT116+ch2 (MMR−) cells. Tumour cells were double-stained with MLH1 or MSH2 (green) and Hsp27 or Hsp72 (red) antibodies. Colocalisation was revealed by the signals overlap (yellow) in the merged images. A scale bar was included in each microphotograph (20 μm). Control, untreated cells; cPt 24, cells collected 24 h after 10 μM cPt exposure. H+cPt 24, cells treated with cPt 24 h after H, and collected 24 h later.
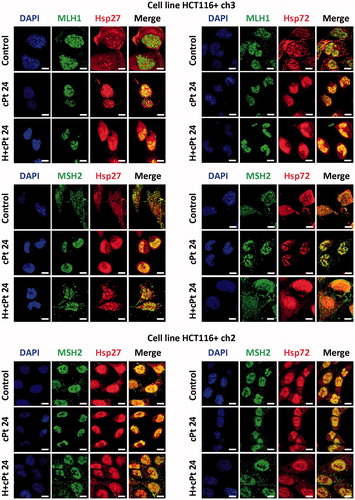
Figure 3. Changes of Pearson’s correlation coefficient (PCC) and Manders’s correlation coefficients (MCC-M1 and MCC-M2) following cPt and H+cPt administration. (A) HCT116+ch3 cells (MMR+). Coefficients show that MLH1 colocalises with Hsp27 and Hsp72. MSH2 colocalises with Hsp27 and Hsp72. (B) HCT116+ch2 cells (MMR−). Graphs show colocalisation coefficients for MSH2 protein with Hsp27 and Hsp72. Bars represent mean ± SEM. Significant differences were calculated with respect to the control group. *p < 0.05; **p < 0.01; ***p < 0.001.
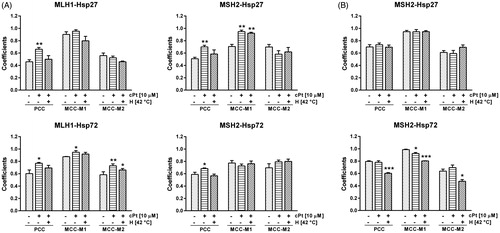
Figure 4. MLH1 and MSH2 interact with Hsp27 and Hsp72 in HCT116 + ch3 and HCT116 + ch2 cells. MLH1 (A) and MSH2 (B) were immunoprecipitated from MMR+ cell extracts treated with cPt or H+cPt and analysed by immunoblotting for co-precipitation with Hsp27 and Hsp72. (C) MSH2 immunoprecipitates from MMR- cells exposed to cPt and H+cPt. (D) Negative controls included whole cell lysate 20 µg (lane 1), mouse monoclonal IgG isotype control (lane 2), unconjugated Dynabeads (lane 3), incubation of whole cell extract with isotype IgG/Dynabeads complexes (lane 4). Input, total protein from cell lysates; Control IP, control mouse IgG.
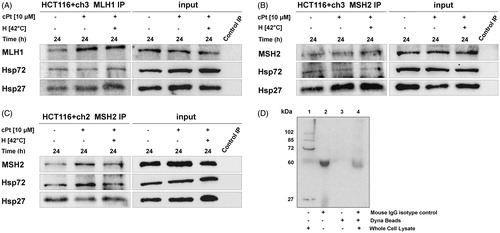
Figure 5. Immunoblot analysis of Hsp27, Hsp72 and DNA repair proteins MSH2 and MLH1 after cPt or H+cPt treatment in colon cancer cells. (A) Immunoblots using the total protein extracts from HCT116+ch2 (MMR−) and HCT116+ch3 (MMR+) cells; 20 µg of proteins were loaded and resolved by SDS-PAGE using 7.5% polyacrylamide gels. (B) Densitometric quantification of immunoblots (Mean ± SEM). Protein bands were normalized to β-actin (optical density ratio). Statistical comparisons were calculated with respect to untreated control cells. *p < 0.05.
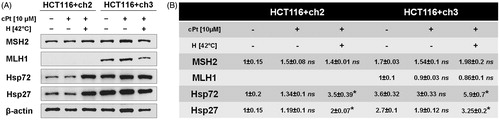
Figure 6. Hyperthermia followed by cPt treatment decreases MMR+ cells (HCT116 + ch3) viability, and induces p73 expression and cell cycle arrest. (A) Cell viability studied by MTT assay in MMR− and MMR+ cells (black and grey bars, respectively). (B) Immunoblotting of wild type p53 and p73 after cPt or H+cPt treatments. Proteins (30 µg) were loaded and resolved by SDS-PAGE using 7% polyacrylamide gels. β-actin was used as loading control. Quantification graphs were included. (C) Representative histograms and proportion of HCT116+ch2 (MMR−) and HCT116+ch3 (MMR+) cells in G0/G1, S and G2/M phases. Bars represent mean ± SEM. Significant differences were calculated with respect to the control group. *p < 0.05.
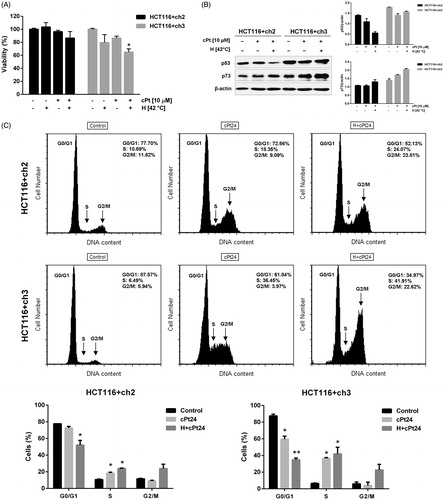
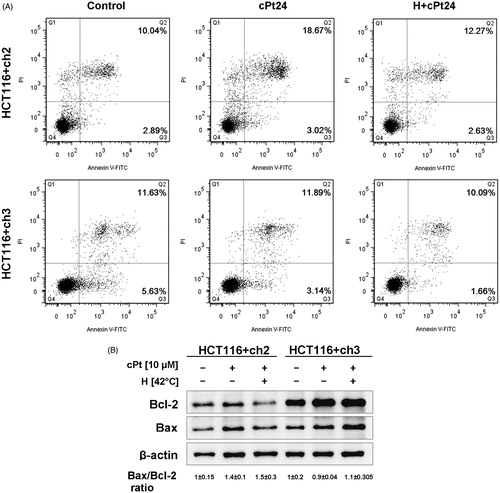
Figure 7. Hyperthermia does not induce apoptotic changes or affect the Bax/Bcl-2 ratio in either MMR− or + cells. (A) Flow cytometry analysis of apoptosis by Annexin V and PI staining, 24 h after cPt and H+cPt. The dot plots showed the percentage of events corresponding to: necrotic (Q1, Annexin V−/IP+), late apoptotic (Q2, Annexin V+/IP+), early apoptotic (Q3, Annexin V+/IP−) and viable cells (Q4, Annexin V−/IP−). (B) Immunoblotting of Bax and Bcl-2 in HCT116+ch2 (MMR−) and HCT116+ch3 (MMR+) cells. Proteins (30 µg) were resolved by SDS-PAGE using 12% polyacrylamide gels. β-actin was used as loading control. The image shows Bax/Bcl-2 ratio (mean ± SEM).