Figures & data
Figure 1. Variation of temperature with time as recorded on five thermocouples placed in different tubes in the thermal cycler during the same experiment. Temperature was recorded three times a second.
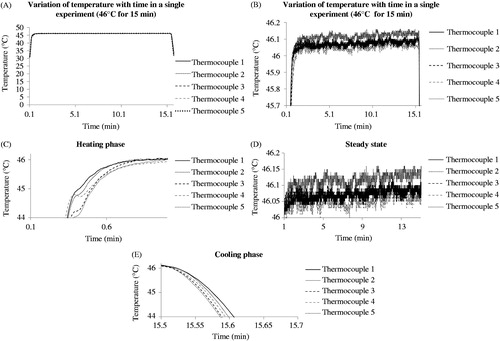
Table 1. Thermal exposure of colon cancer cells, and associated thermal dose accuracy.
Figure 2. Cell viability as a function of time after exposure for two colon cancer cell lines subjected to TDs of 0, 60, 120 and 240 min, assessed using an MTT assay. Results are presented as means + SD of three independent experiments (each of which provided four datasets).
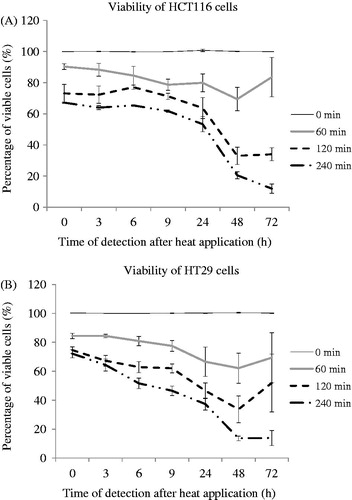
Figure 3. Induction of apoptosis in HCT116 and HT29 cells exposed to TDs of 0, 60, 120 and 240 min on days 0, 1 and 2, assessed using an ELISA assay. Statistically significant increases in cleaved cytoplasmic nucleosomes relative to controls (TD = 0) were seen in HCT116 cells treated with TDs of 60 min (day 0, day 1, day 2, Panel A) and 120 min (day 1, day 2, Panel A), and in HT29 cells treated with a TD of 60 min (day 0, day 1, Panel B), 120 min (day 1, day 2, Panel B) and 240 min (day 2, Panel B). Results are presented as mean + SEM of at least three experiments each of which provided two datasets. Statistical analysis was performed using a one-tail paired t-test; p < 0.05 was considered to be significant and is denoted by an asterisk.
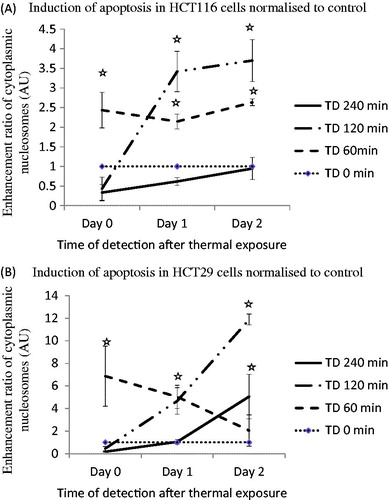
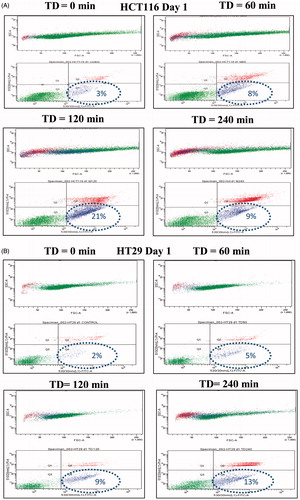
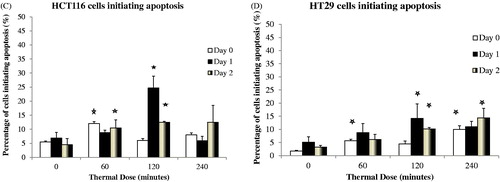
Table 2. Percentage of viable, necrotic and apoptotic cells (single experiment).
Figure 5. TD induced autophagy. HCT116 and HT29 cells exposed to TDs of 0, 60, 120 and 240 min. Autophagy was assessed on day 0 and day 1 after treatment using an antibody against LC3II levels. Results are presented as single set of representative blots (Panels A and B) and mean + SEM (Panels C and D) of densitometry data normalised for actin of three independent experiments.
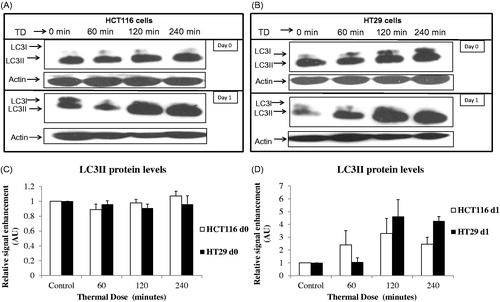
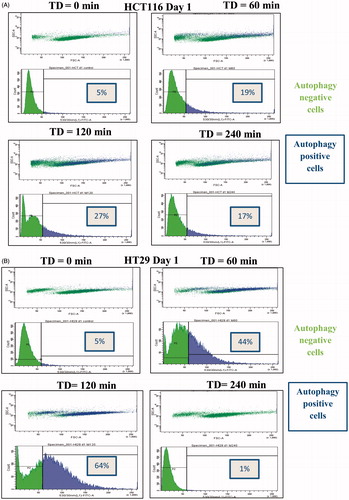
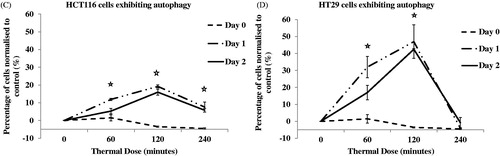
Table 3. Percentage of cells showing increased autophagy (single experiment).
Figure 7. Effect of necrostatin on the viability of cells after exposure to heat. The RIPK3 protein levels of HCT116 (Panels A and C) and HT29 (Panels B and D) colon cancer cells exposed to TDs of 0, 60, 120 and 240 min was assessed using immunoblotting immediately, and 1 day, after treatment. Immunoblotting results are presented as a blot representative of three independent experiments. They are semi-quantified using densitometry normalised for actin showing mean + SEM (n = 3). HCT116 and HT29 cells exposed with or without necrostatin and TDs of 0, 60, 120 and 240 min are shown with cell viability assessed using the MTT assay (Panels E and F). MTT viability data are presented as mean ± SEM of three independent experiments (each of which provided 4 datasets).
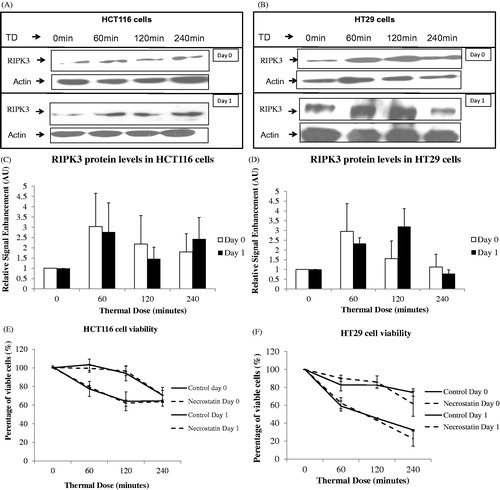
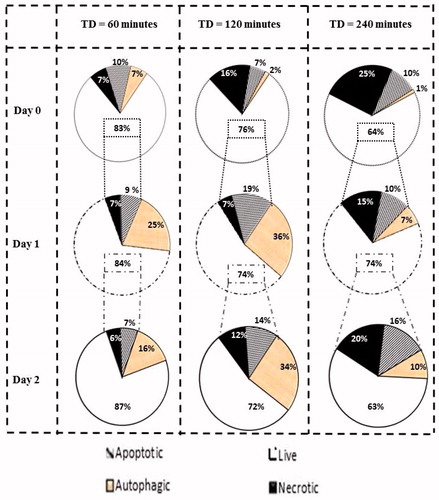
Figure 8. Percentage of cells undergoing each type of programmed cell death. Graphs show percentages of live cell populations and those undergoing necrosis, apoptosis and autophagy at different time points (0 to 2 days) in response to TDs of 60, 120 and 240 min. Cell populations undergoing autophagy may overlap with survival or dying cells.