Figures & data
Table 1. Particle size and Zeta potential of nanoparticles.
Figure 1. Transmission electron micrographs of nanoparticles: (A) 5-FU-loaded PLGA-coated nanoparticles with iron core, (B) PLGA-coated nanoparticles without iron core.
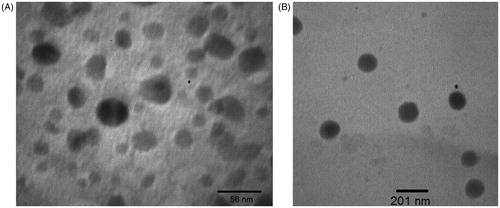
Figure 2. In vitro release profiles of 5-FU from 5-FU-loaded PLGA-coated nanoparticles with/without iron core. The plot represents mean ± SD of triplicate results.
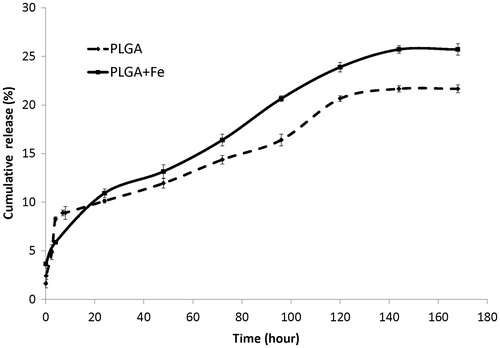
Figure 3. The images confirm the entry of nanoparticles into the cell: (A) control image, (B) image with nanoparticles.
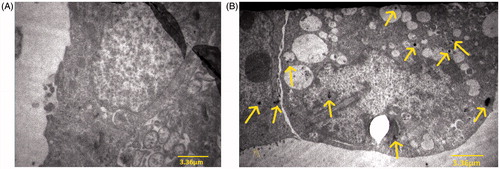
Figure 4. Effects of different concentrations of 5-FU and hyperthermia on (A) 5-FU-loaded PLGA-coated nanoparticles without iron oxide core, (B) 5-FU-loaded PLGA-coated nanoparticles with iron core with hyperthermia, and (C) the viability of HT-29 spheroid culture cells. The viability was measured using trypan blue dye exclusion assay method. Mean ± SEM of three experiments.
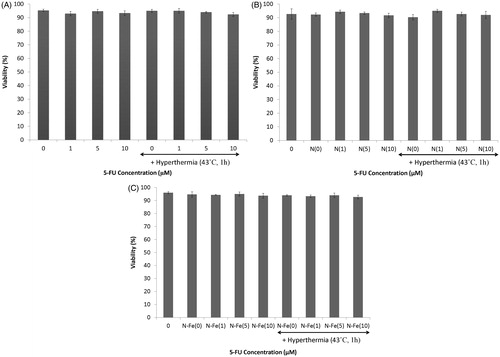
Figure 5. Effects of different concentrations of 5-FU with and without hyperthermia on induced DNA damage of HT-29 spheroid culture cells. Mean ± SEM of three experiments.
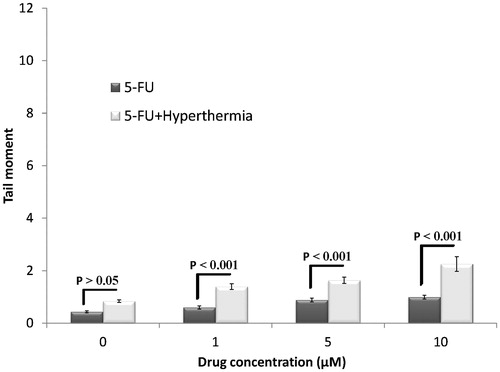
Figure 6. Effects of different concentrations of 5-FU or 5-FU-loaded nanoparticles with and without iron core on induced DNA damage of HT-29 spheroid culture cells. Mean ± SEM of three experiments.
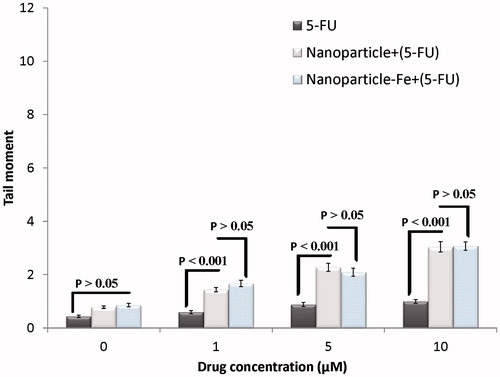
Figure 7. Effects of 5-FU-loaded PLGA-coated iron-free nanoparticles with and without hyperthermia on induced DNA damages of HT-29 spheroid culture cells. Mean ± SEM of three experiments.
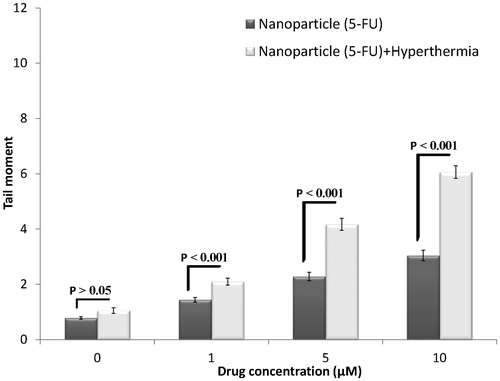
Figure 8. Effects of 5-FU-loaded PLGA-coated iron oxide nanoparticles with and without hyperthermia on induced DNA damage of HT-29 spheroid culture cells. Mean ± SEM of three experiments.
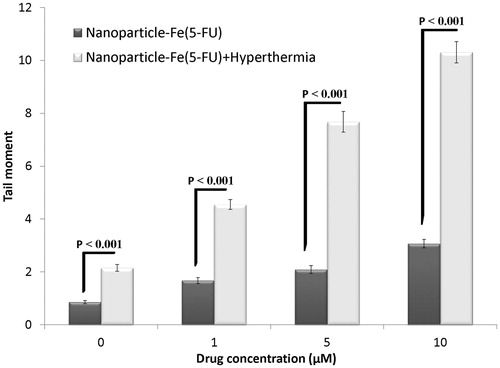
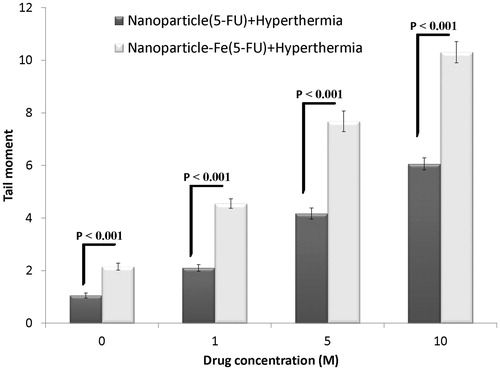
Figure 9. Effects of 5-FU-loaded nanoparticles with and without iron oxide combined with hyperthermia on induced DNA damage of HT-29 spheroid culture cells. Mean ± SEM of three experiments.