Figures & data
Table 1. Patient and treatment characteristics, i.e. tumour location, number of treatments and number of probes per tissue as used in the evaluation, thus excluding the first treatment since this data was already used for parameter optimisation. Note that for all treatments invasive probe measurements were available.
Table 2. Literature values of EM and thermal tissue properties for T simulations at 37 °C, Baseline [Citation5,Citation25–28,Citation31]. See for ‘thermal stress’ (T-stress) and ‘steady-state optimised’ (SSopt) values.
Figure 1. Predicted 3D temperature distribution on the planning CT shown together with the catheter track (solid green line) with a measurement probe at the tip inside the challenging-to-heat nasopharynx tumour (A). As illustration, we show the temperature during treatment (B) for the temperature measured at the tip (solid black) compared with the predicted temperatures using Group (dash-dot purple), Patient (dashed red) and Session (solid orange) parameter values, when six parameters were optimised using an applicator efficiency factor of 100%. Results for an applicator efficiency factor of 40% were similar and therefore not shown.
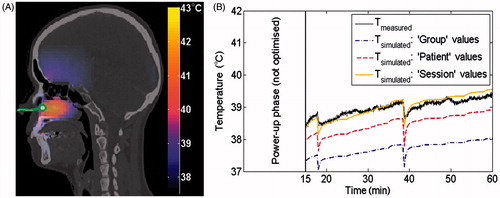
Figure 2. Block scheme of the optimisation procedure.
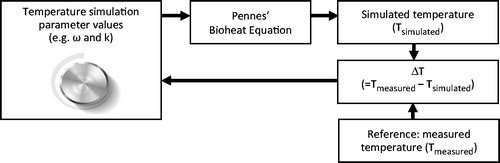
Table 3. Patient-group optimised values of transient temperature simulations using an applicator efficiency factor of η: 100% and η: 40%. For comparison, we also show literature values for these thermal tissue properties for T simulations at 37 °C: Baseline [Citation5,Citation25–28,Citation31], thermal stress (T-stress) [Citation29] and steady-state optimised (SSopt) values [Citation9].
Figure 3. Comparison of the transient temperature simulation accuracy (ΔT) when applying Group, Patient or Session parameter values from transient simulations using an applicator efficiency factor of 100% (Tropt η: 100%) or 40% (Tropt η: 40%). As a cross-check, the Group parameter values from steady-state simulations (SSopt) are given. Statistically significant differences are indicated for Group versus Patient (Δ), Group versus Session (▹) and Patient versus Session (◃). In the box-plots, the central mark is the median, the edges are the 25th and 75th percentiles, the whiskers extend to the most extreme data points not considered outliers (99.3%), and outliers are plotted individually (+).
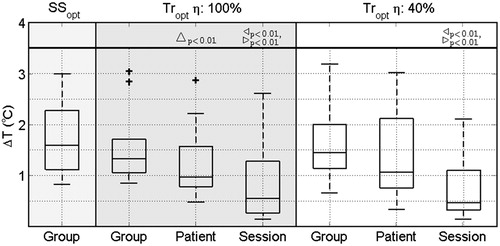
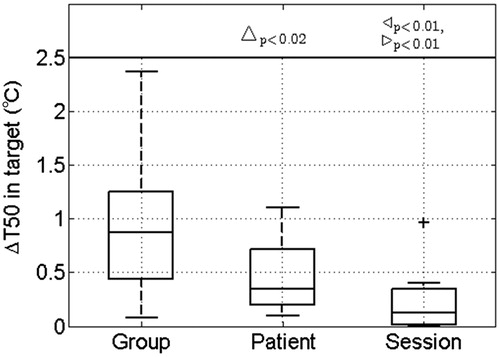
Figure 4. The feasibility of 3D dosimetry quantified by the difference in measured and simulated T50 in the target (ΔT50) using transient temperature simulation with an applicator efficiency of 40% when applying Group, Patient or Session parameter values. Note that the T50 could only be computed for eight patients since they received invasive measurements inside the target. Statistically significant differences are indicated for Group versus Patient (Δ), Group versus Session (▹) and Patient versus Session (◃). In the box-plots the central mark is the median, the edges are the 25th and 75th percentiles, the whiskers extend to the most extreme data points not considered outliers (99.3%) and outliers are plotted individually (+).