Figures & data
Figure 1. (A) The Visualase® applicator modelled in this application and a diagram of the photon emitting diffusing tip and the cooling fluid are shown. (B) A finite element mesh conforms to the applicator and is used as the template for the calculations. (C) A representative time–temperature history profile is shown of the thermometry data at two points within the brain tissue, ∼1 mm from the applicator. The corresponding power history is also shown.
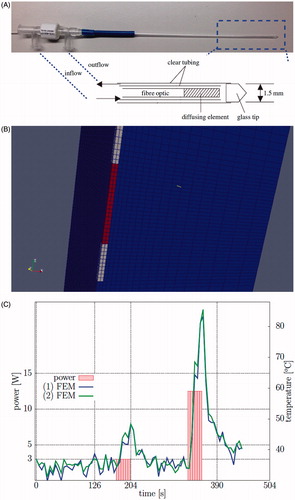
Table 1. Constitutive data [Citation38–40].
Figure 2. Representative thermometry data and calibrated model damage predictions. (A) The magnitude of the complex valued thermometry data provides a visualisation of the anatomy and is provided as a reference. The applicator trajectory is observed as a signal void in the image. The ROI displayed has a 3.75 × 3.28 cm2 field of view and is shown in B–D. (B) MR thermometry at maximum heating is shown. (C) finite element method (FEM) model-predicted Arrhenius damage is compared to Arrhenius damage based on MRTI. (D) A comparison of the steady-state damage model is shown. The steady-state damage model is the region enclosed by the 57 °C isotherm. The colour map indicates the geometrical overlap used in DSC calculations; the legend is at right (C). Respective DSC values for the FEM model (C) and steady-state model (D) are DSC = 0.8385 and DSC = 0.7442.
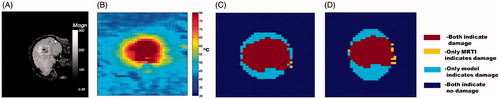
Figure 3. Presented here are histograms of calibration analysis from the transient FEM model (A) and steady-state model (B), shown left and right, respectively. Both histograms have a bin width of 13.0 m−1. The optical parameters, μeff, recovered from each thermometry dataset considered are shown. For each calibration the bound constrained optimisation was restricted to a range obtained from literature, μeff ∈ [0.8, 400] m−1. Leave-one-out cross-validation was performed using these 22 μeff values. The nominal value in brain tissue obtained from Welch and van Gemert [Citation39] is μeff = 180 m−1.
![Figure 3. Presented here are histograms of calibration analysis from the transient FEM model (A) and steady-state model (B), shown left and right, respectively. Both histograms have a bin width of 13.0 m−1. The optical parameters, μeff, recovered from each thermometry dataset considered are shown. For each calibration the bound constrained optimisation was restricted to a range obtained from literature, μeff ∈ [0.8, 400] m−1. Leave-one-out cross-validation was performed using these 22 μeff values. The nominal value in brain tissue obtained from Welch and van Gemert [Citation39] is μeff = 180 m−1.](/cms/asset/800fe48c-7968-4293-8c03-3450672ebae5/ihyt_a_1055831_f0003_c.jpg)
Table 2. The descriptive statistics for μeff during optimisation and DSC performance during optimisation and LOOCV (N = 22). The transient solve of the Pennes bioheat equation using the Arrhenius damage, Equation Equation1 (1) , is denoted by FEM. Steady-state analysis using the 57 °C isotherm damage model is denoted SS. Note that all DSC, skewness, and kurtosis quantities are unitless. %-ile refers to percentiles, e.g., 25%-ile means the dataset’s DSC performance exceeds 25% of the population DSC values in ranked order.
Table 3. The percentiles that correspond to several interesting DSC thresholds. The ‘opt.’ and ‘LOOCV’ columns refer to the same groups of datasets described in , as well as the datasets plotted in . The smaller the percentile value, the better the model’s performance. ‘0’ indicates all values pass at the given threshold; ‘100’ indicates no values pass.
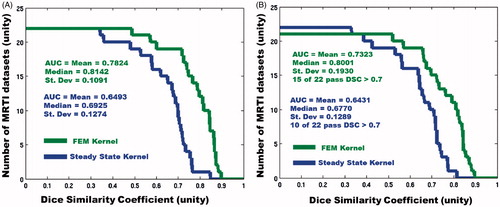
Figure 4. Here, the overall predictive performance, measured by DSC, is displayed for both models. (A) Left is the performance during optimisation, and (B) the right is during LOOCV. The horizontal axis displays increasing DSC thresholds; the vertical axis displays the number of datasets that pass the DSC threshold. Greater area under the curve (AUC) indicates better prediction. In the FEM LOOCV plot, there is one dataset that has a DSC = 0 and therefore does not appear on the plot.