Figures & data
Figure 1. 2D axis symmetric RFA model and its boundary conditions used in the present study (out of scale, dimension in mm).
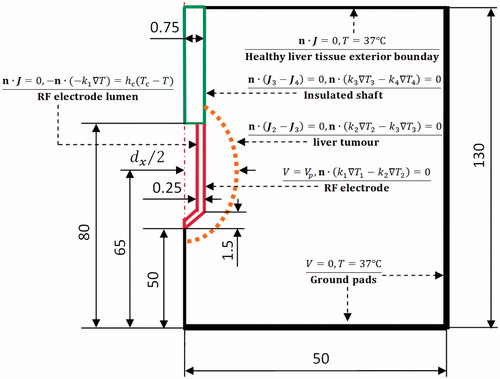
Table 1. Thermal and electrical properties of the modelling elements used in the present study.
Figure 2. Thermal and electrical conductivities of healthy liver tissue and liver tumour used in the present study.
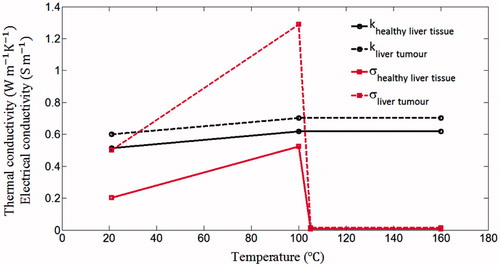
Table 2. Comparisons of TTN areas from the FEM and in vitro experiment.
Figure 3. Two pulsed RF power supply methods: (A) half-square waveform and (B) half-sine waveform.
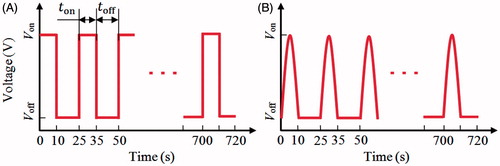
Figure 4. Finite element models and their mesh modes used in the present study for three sizes of target tissues: (A) 25 mm, (B) 30 mm and (C) 35 mm.
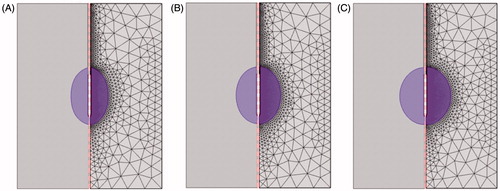
Figure 5. In vitro experimental set-up for the validation of the FEM.
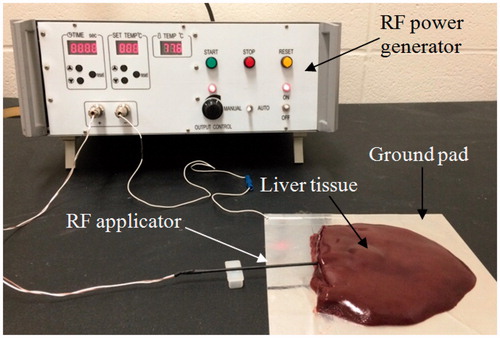
Figure 6. Computational and experimental results for two ablation operations: (A) 360 s, (B) 720 s.
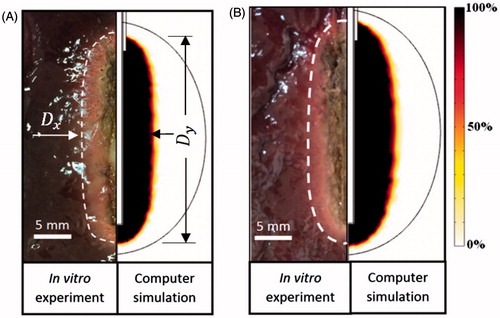
Figure 7. 100 °C isotherm and temperature distribution of the scenario of 47.2 V-720 s at 50 s (A), 442 s (B) and 720 s (C) and the change of the impedance (D).
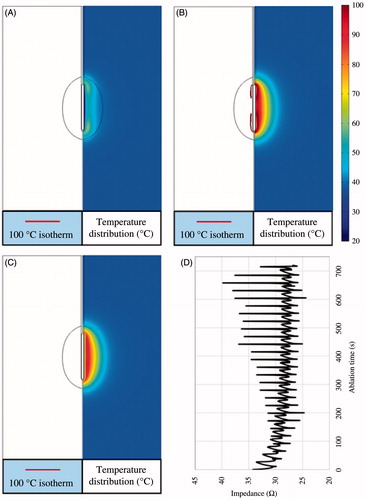
Figure 8. 100 °C isotherm and temperature distribution of the scenario of 48 V-145 s at 25 s (A), 118 s (B) and 145 s (C) and the change of the impedance (D).
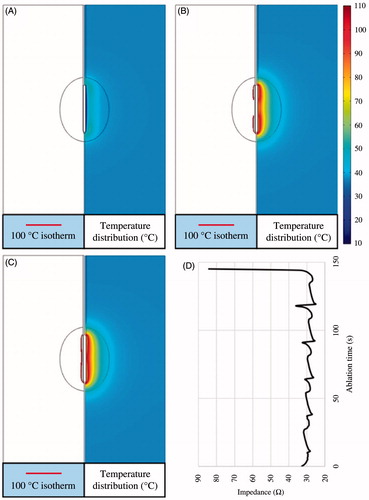
Figure 9. Computational results of TTN areas for target tissues with different sizes: (A) dx = 25 mm, (B) dx = 30 mm and (C) dx = 35 mm.
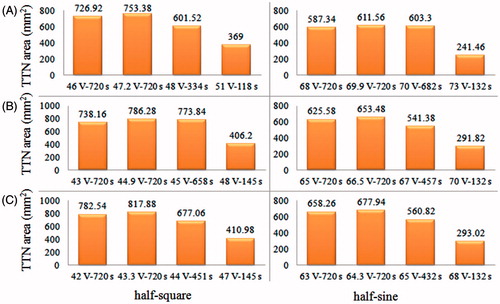
Table 3. The computational results of TTN area for all PRFA protocols in the present study.
Figure 10. Target tissue death rate (%) (D63) at its own MVA: (A) dx = 25 mm, (B) dx = 30 mm and (C) dx = 35 mm and the changes of the TTN areas (D).
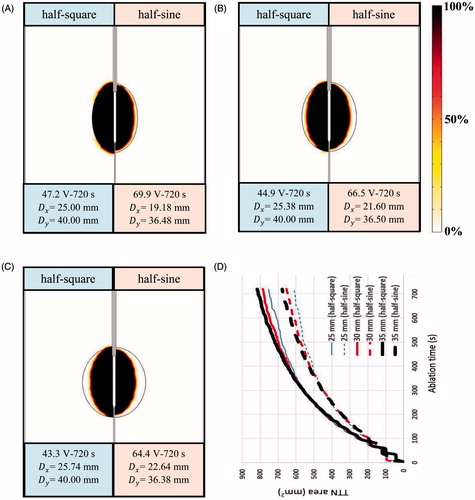
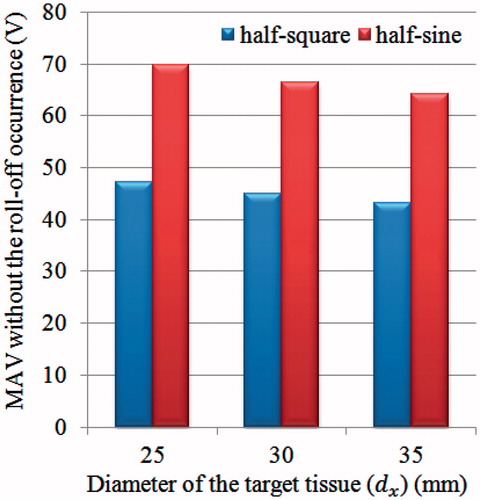
Figure 11. MVA without the roll-off occurrence for each size of target tissue in the present study.