Figures & data
Figure 1. Stimulus pattern of the working memory task for fMRI block design. There was a 12 s dummy scan ahead of the experiment. At the first 30 of the run, the participants should fix on the cross point and do nothing, followed by stimulus images. Participants were asked to judge whether the probe matched the target in the sample display with the whole process being limited to 30 s. Then another fixation followed was continued 30 s. The procedure mentioned above went on alternately for five blocks with a dummy scan of 30 s as the ending. The whole experiment costs 5 min 42 s.
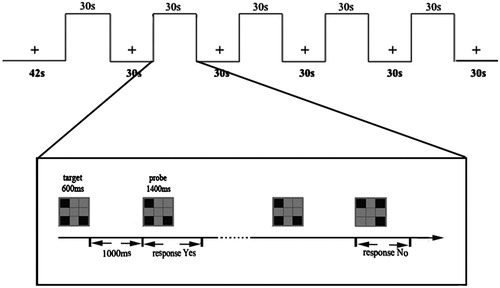
Figure 2. Regions showing group differences in voxel-mirrored homotopic connectivity. Warm colors indicate increased VMHC in hyperthermia condition (50 °) compared to normal control condition (25 °). Group differences were a corrected cluster threshold of p = 0.005. The Z-score bar is shown at the middle of the figure.
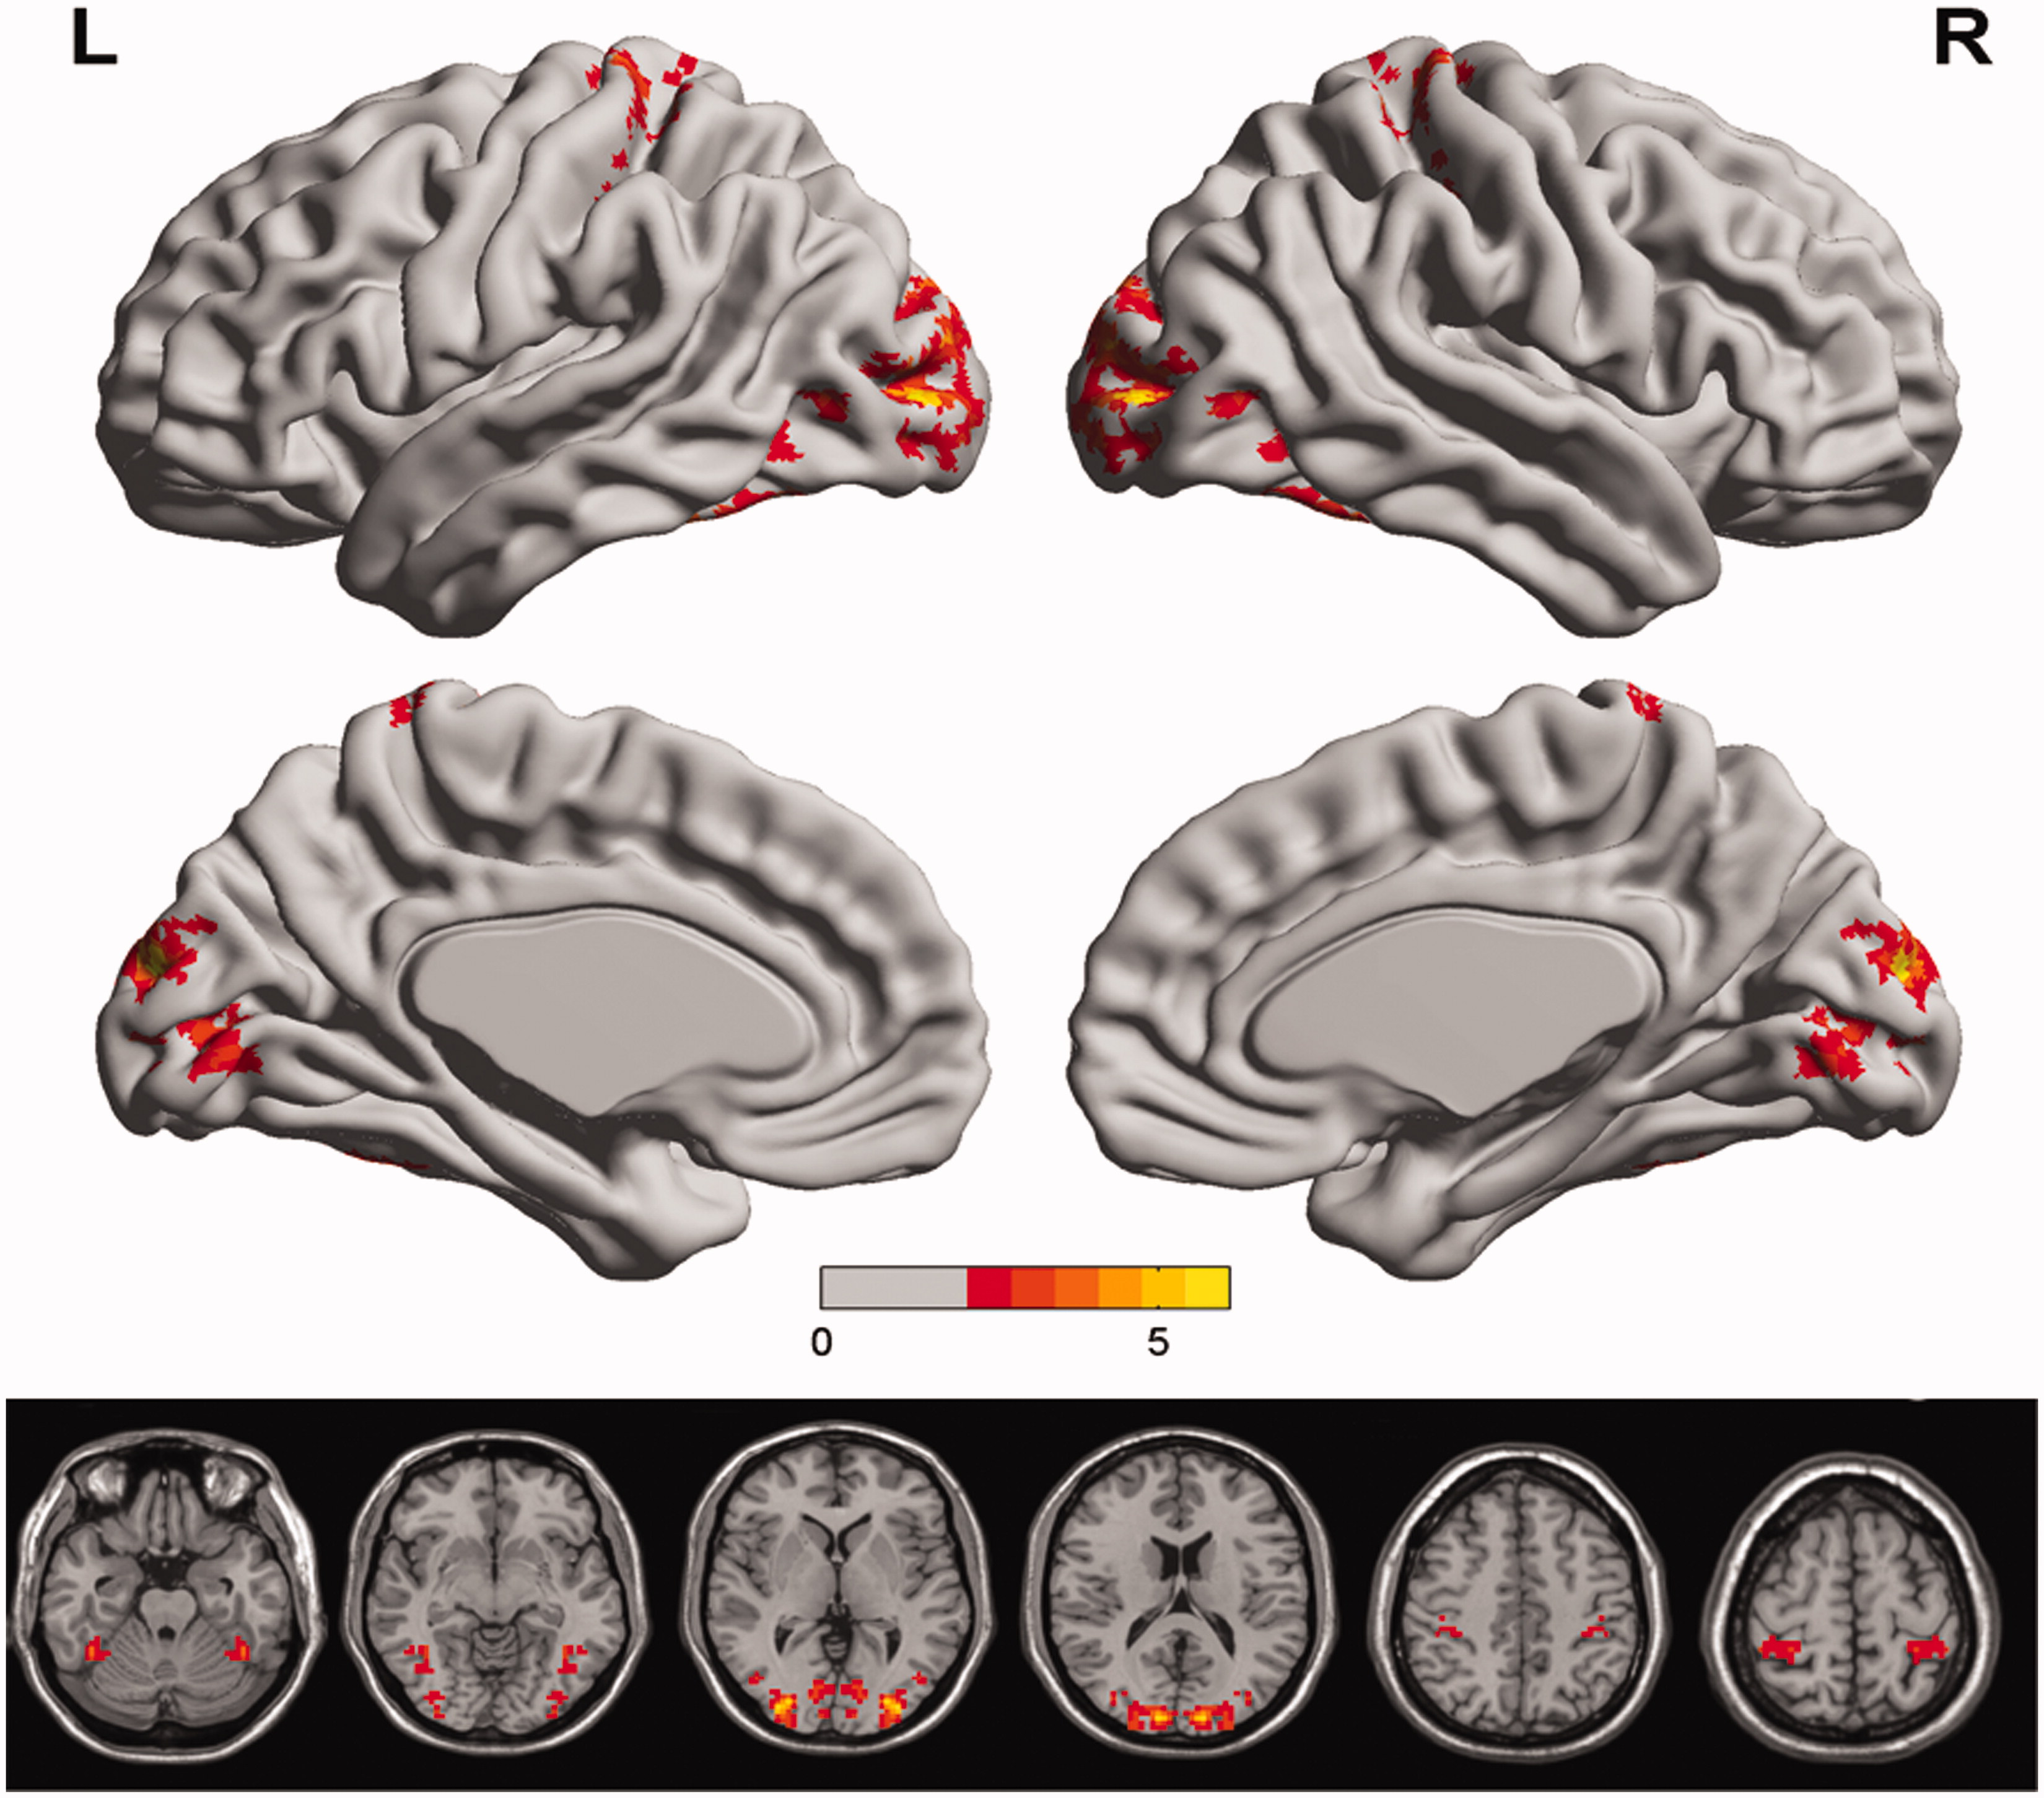
Table 1. Regions showing group differences in voxel-mirrored homotopic connectivity.
Table 2. Mean RT (and SD) and accuracy (and SD) for each condition.
Figure 3. Regions showing significant negative correlations between VMHC and reaction time of working memory in normal control enviroment. The region in bilateral superior temporal gyrus, and bilateral middle frontal gyrus showing significant positive correlation between the VMHC and reaction time of working memory task; cool colors indicate negative correlations. The statistical threshold was p < 0.005. (The correction threshold was determined by a Monte Carlo simulation). The Z-score bars are shown at the middle of the figure.
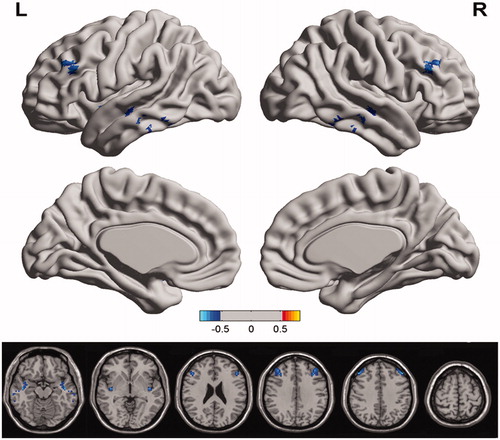
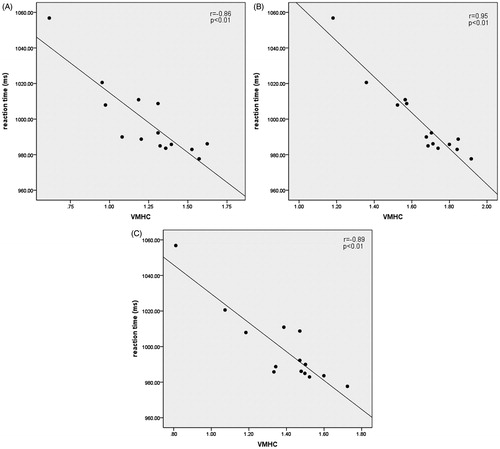
Figure 4. The scatterplots of the VMHC values in normal control enviroment along the x-axis, and WM score along the y-axis, with A for bilateral superior temporal gyrus and B for bilateral middle frontal gyrus.
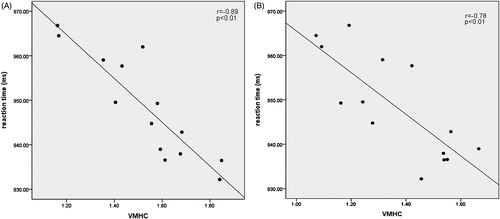
Figure 5. Regions showing significant negative correlations VMHC and reaction time of working memory under heat stress. The region in bilateral inferior frontal gyrus, bilateral middle frontal gyrus, as well as cerebellum posterior lobe showing significant negative correlation between the VMHC and reaction time of working memory task; cool colors indicate negative correlations. The statistical threshold was p < 0.005. (The correction threshold was determined by a Monte Carlo simulation). The Z-score bars are shown at the middle of the figure.
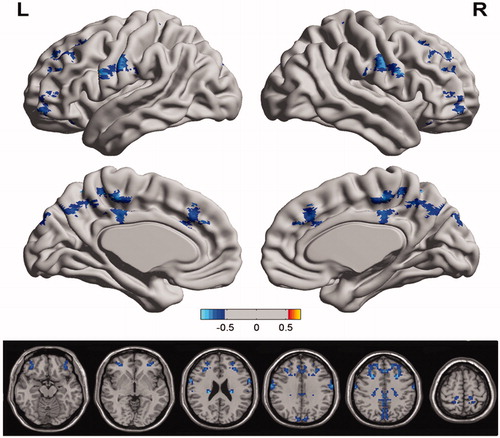
Figure 6. The scatterplots of the VMHC values in hyperthermia enviroment along the x-axis, and WM score along the y-axis, with A for bilateral cerebellum posterior lobe, B for bilateral middle frontal gyrus, and C for bilateral inferior frontal gyrus.