Figures & data
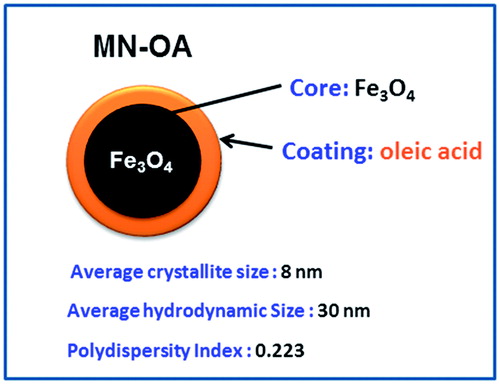
Scheme 1. Scheme for MN-OA formulation and its properties.
Scheme 2. Schedule for MHT of fibrosarcoma tumours and experimental plan to study the underlying mechanism of tumour growth inhibition.
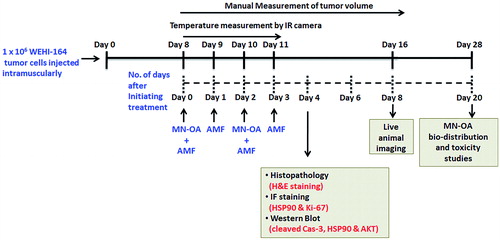
Figure 1. Tumour growth studies. (A) Tumours were subjected to MHT and tumour volume was measured by Vernier caliper. The graph shows the increase in tumour volume measured on different days after initiating the therapy, and * indicates that values (for MN-OA+AMF) are significant at p < 0.05 with respect to control, for respective days. (B) Images captured by a live in vivo animal imaging system on day 8 after initiating the treatment. (C) WEHI-164 cells expressing the luciferase gene were transplanted in female BALB/c mice to obtain tumours and were further subjected to MHT. The luminescence intensity of tumours was measured on day 8 after initiation of treatment, using an in vivo live animal imaging system. Data is presented as mean ± SEM, N = 5 and * indicates that the values are significant at p < 0.05.
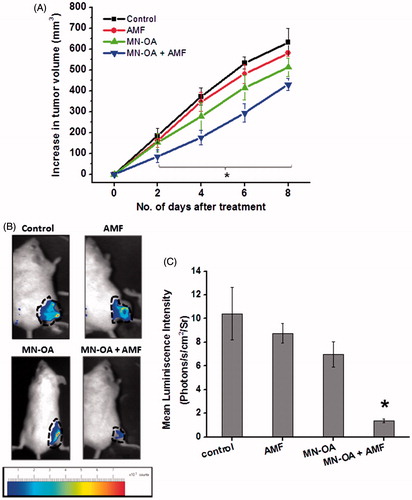
Table 1. Effect of MN-OA-induced MHT on fibrosarcoma tumours expressed in terms of percentage tumour growth.
Figure 2. Mechanism of tumour growth inhibition after MHT was studied by (A) histopathology analysis: tumour sections were stained with H&E, where the nucleus appears as dark blue or purple and cytosol appears dark pink in colour. Arrows indicate apoptotic nuclei; (B) TUNEL assay of tumour tissue sections: values in brackets indicate the average number of apoptotic foci per field ± SEM, N = 5 and arrows indicate apoptotic foci; (C) Western blot analysis for expression of apoptosis marker (cleaved caspase-3) in tumour tissue lysates on day 4 after initiating the treatment. Values represent the relative fold change as compared to control after normalising with GAPDH.
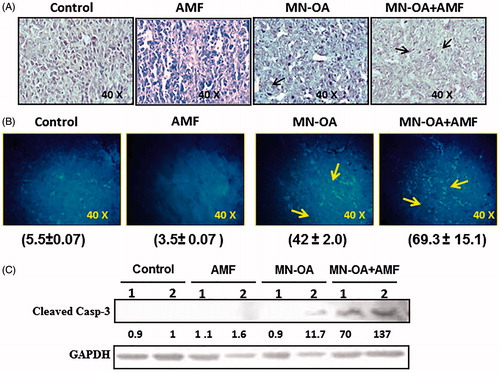
Figure 3. (A) Western blot analysis for the expression of heat shock marker (Hsp90) and cell survival marker (AKT/PKB) in tumour tissue lysates, on day 4 after initiating the treatment. Values represent the relative fold change as compared to control after normalising with GAPDH. (B) Fluorescence microscopy images for tumour sections stained by immunofluorescence staining for expression of cell proliferation marker (Ki-67) and Hsp90 (magnification: 40×). (C) The graph represents fold decrease in the expression of Hsp90 and Ki-67 as compared to control after normalising with MFI of DAPI. * indicates that the values are significant at p < 0.05.
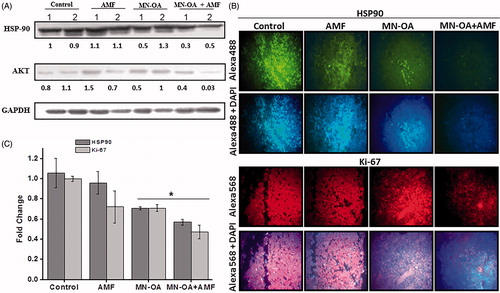
Figure 4. Measurement of tumour surface temperature using an IR camera. (A) Images for temperature rises at the tumour region in mice treated with only AMF and MN-OA + AMF, before and after the therapy. (B) Bar graph of temperature rises at the tumour region for control and treated mice. Values represent mean ± SEM and * indicates that values are significant at p < 0.05.
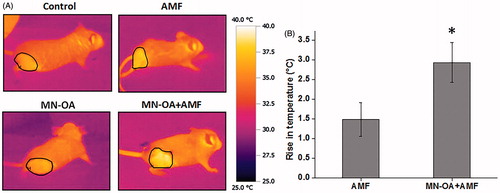
Figure 5. Study of bio-distribution of MN-OA (A) tissue sections of tumour and different organs (liver, kidney, spleen and lungs) were stained by Prussian blue staining to study localisation of Fe. Blue spots correspond to presence of Fe3+, (B) estimation of Fe content in tumour and different organs of control and treated mice using the phenanthroline method.
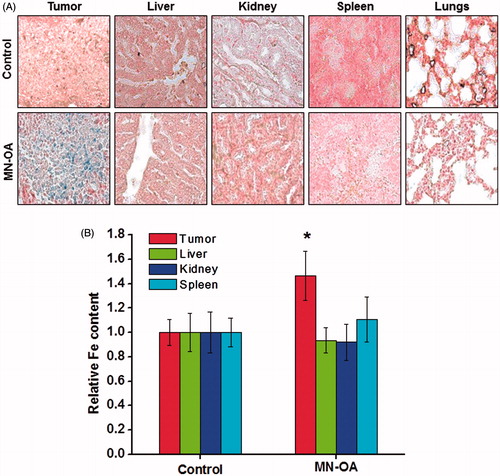
Table 2. Iron content in tumour and different organs in mice treated with MN-OA.
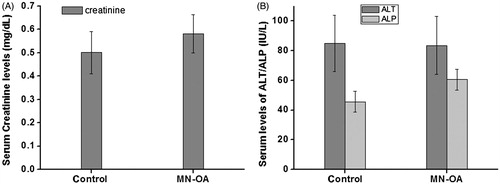
Figure 6. Biochemical analysis of serum for (A) levels of creatinine and (B) levels of ALP and ALT.
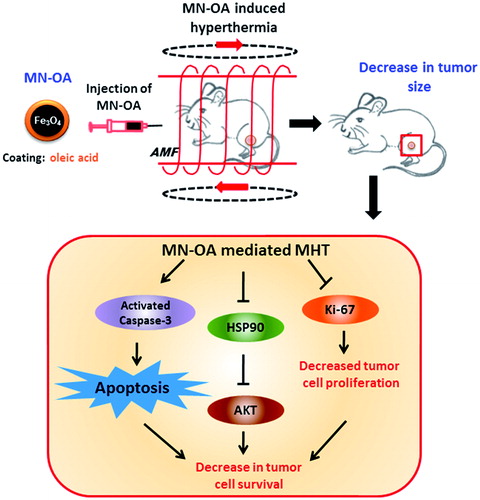
Scheme 3. Proposed mechanism of MHT-induced inhibition of tumour growth.