Figures & data
Figure 1. Components of an MRI-compatible focused ultrasound system used to generate hyperthermia exposures in preclinical experiments. A) The MRI-compatible positioning system is positioned on the patient table of a clinical MR scanner. B) A focused transducer with a 3D-printed acoustic lens. C) Warming tray used to maintain the body temperature of the animal.
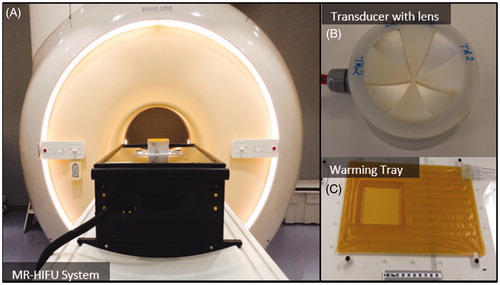
Figure 2. Sector-vortex lens design and normalised contour plots of the spatial intensity distribution parallel to the face of the transducer, at the focal depth (scale bar 2 mm). The location of the focal region remained relatively constant for the different mode lenses.
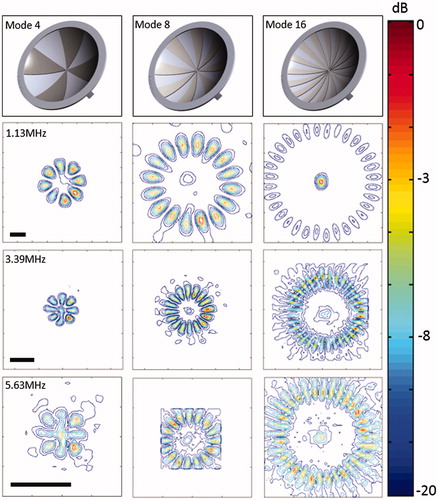
Figure 3. Normalised contour plots of the spatial intensity distribution along the ultrasound beam axis at three different frequencies, using a mode 4 lens.
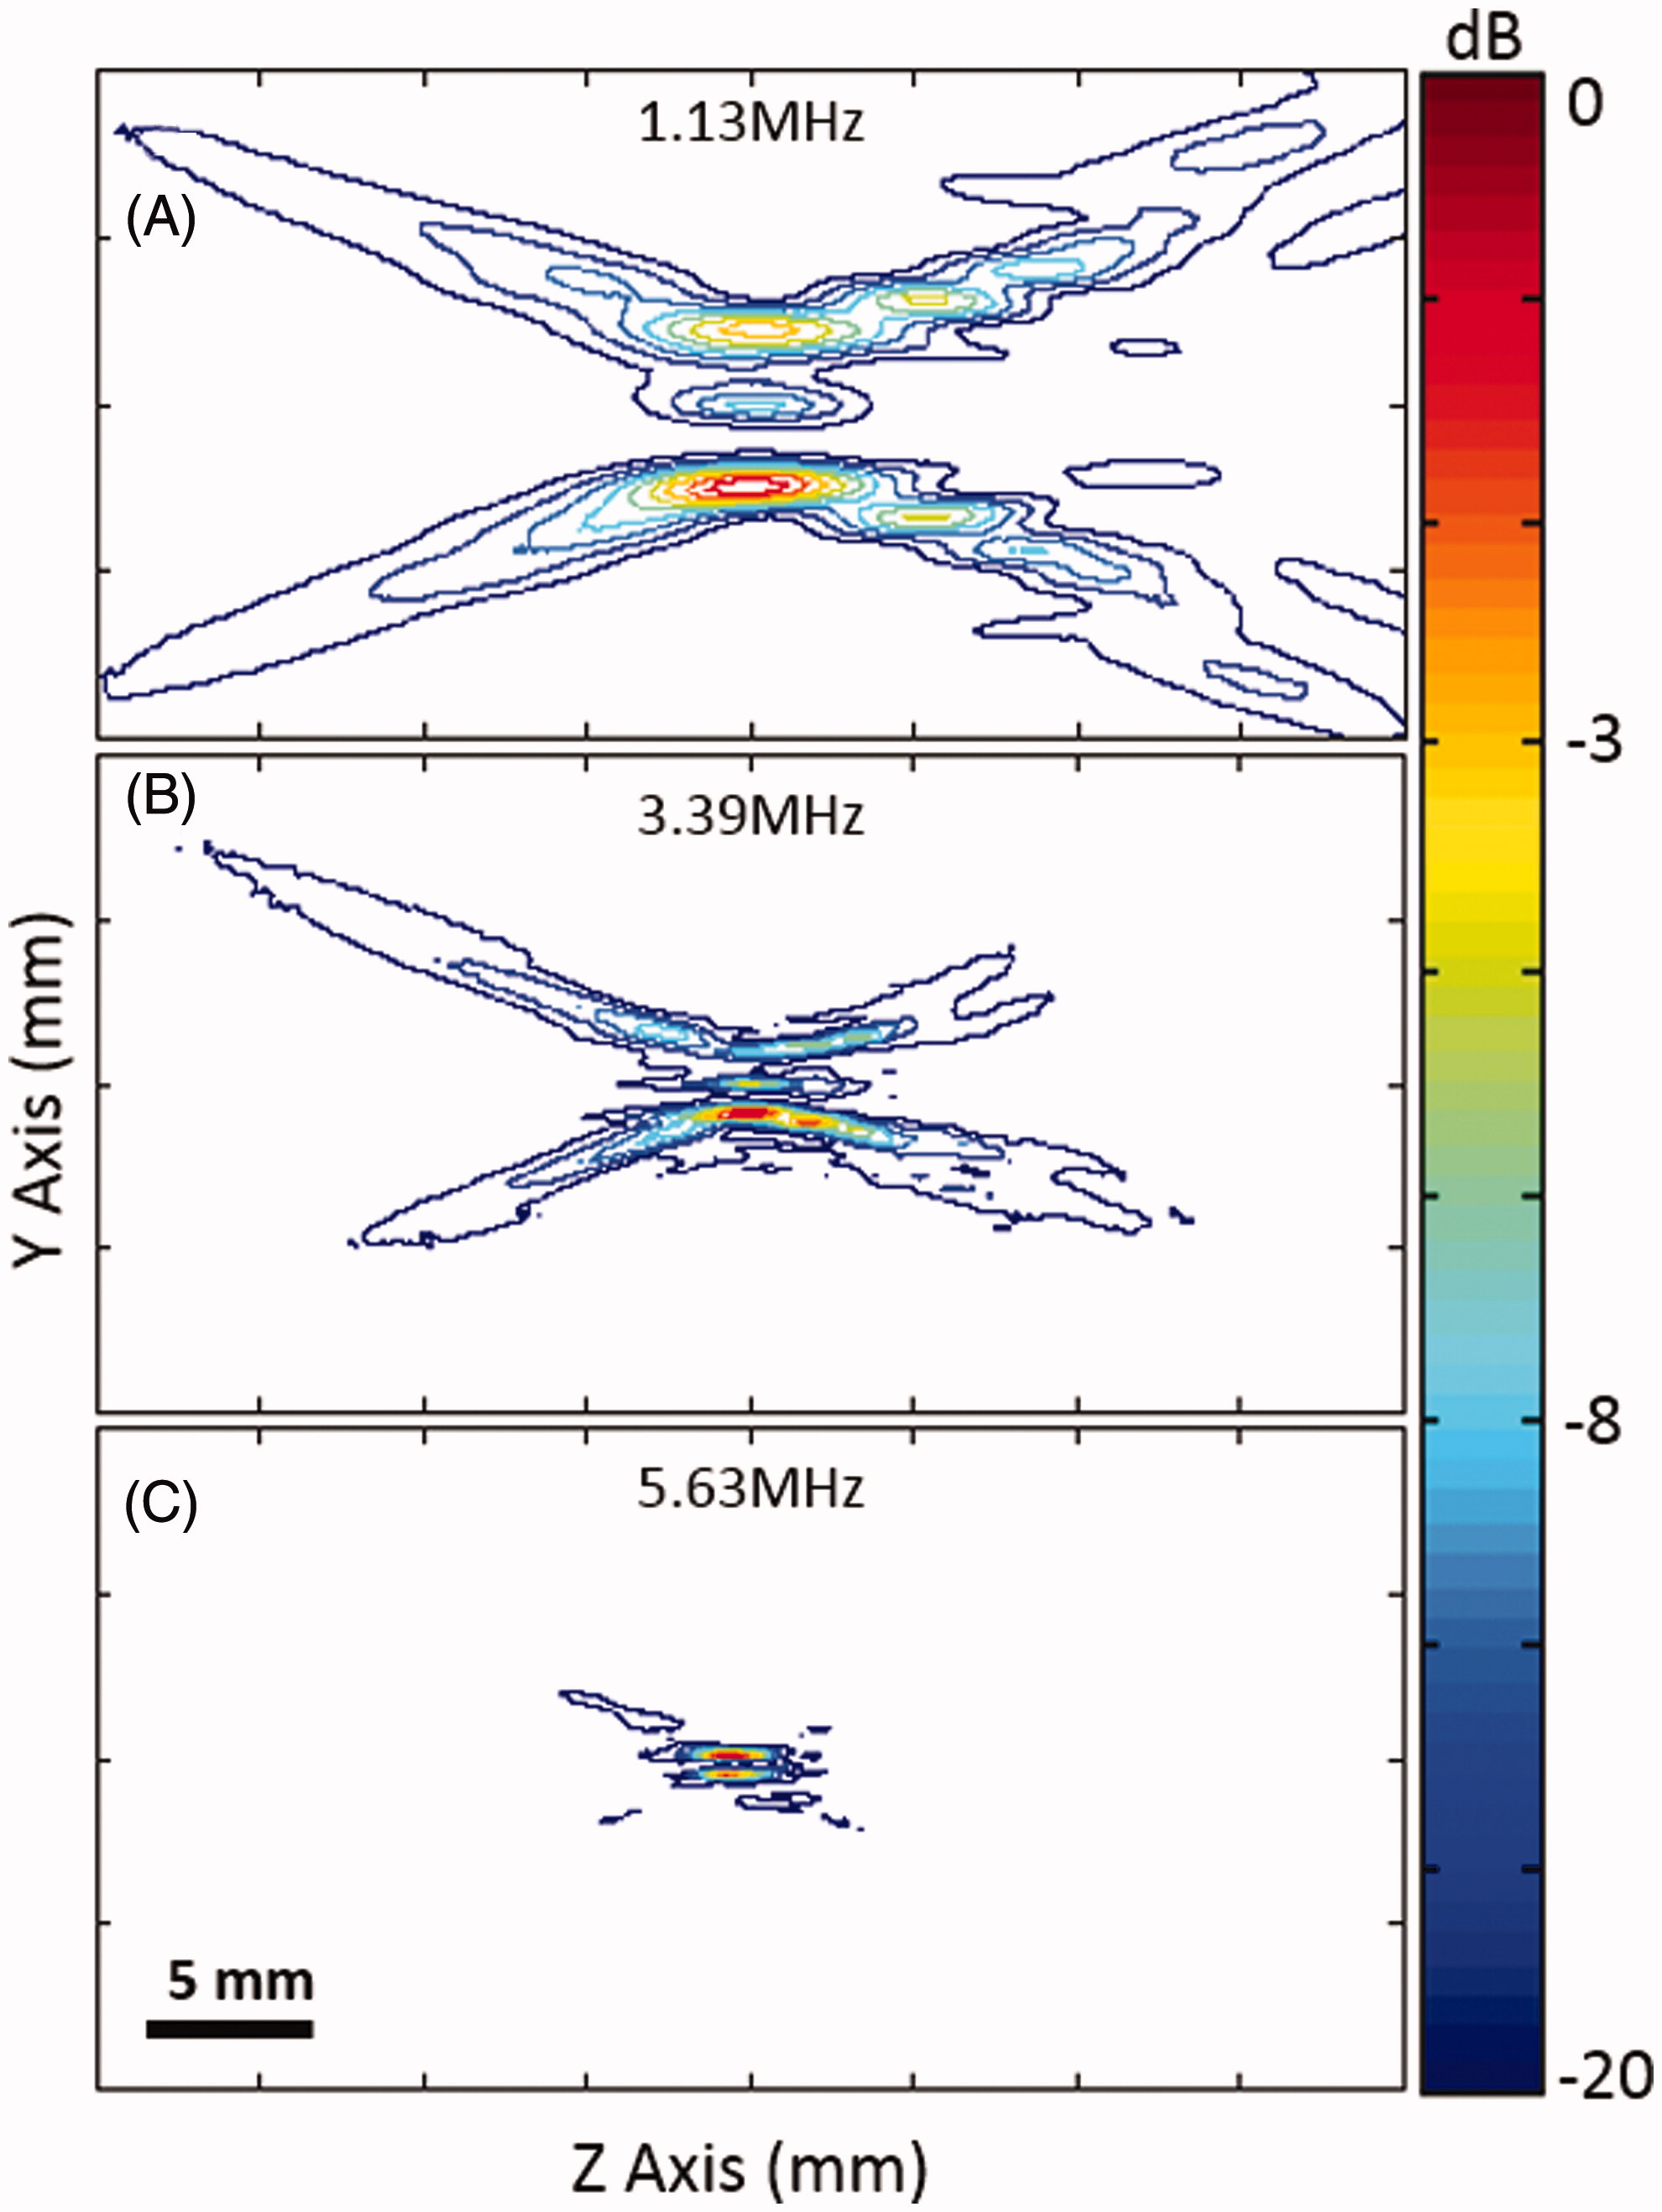
Figure 4. Normalised contour plots of the spatial intensity distribution along the ultrasound beam axis at three different frequencies, using a mode 4 lens.
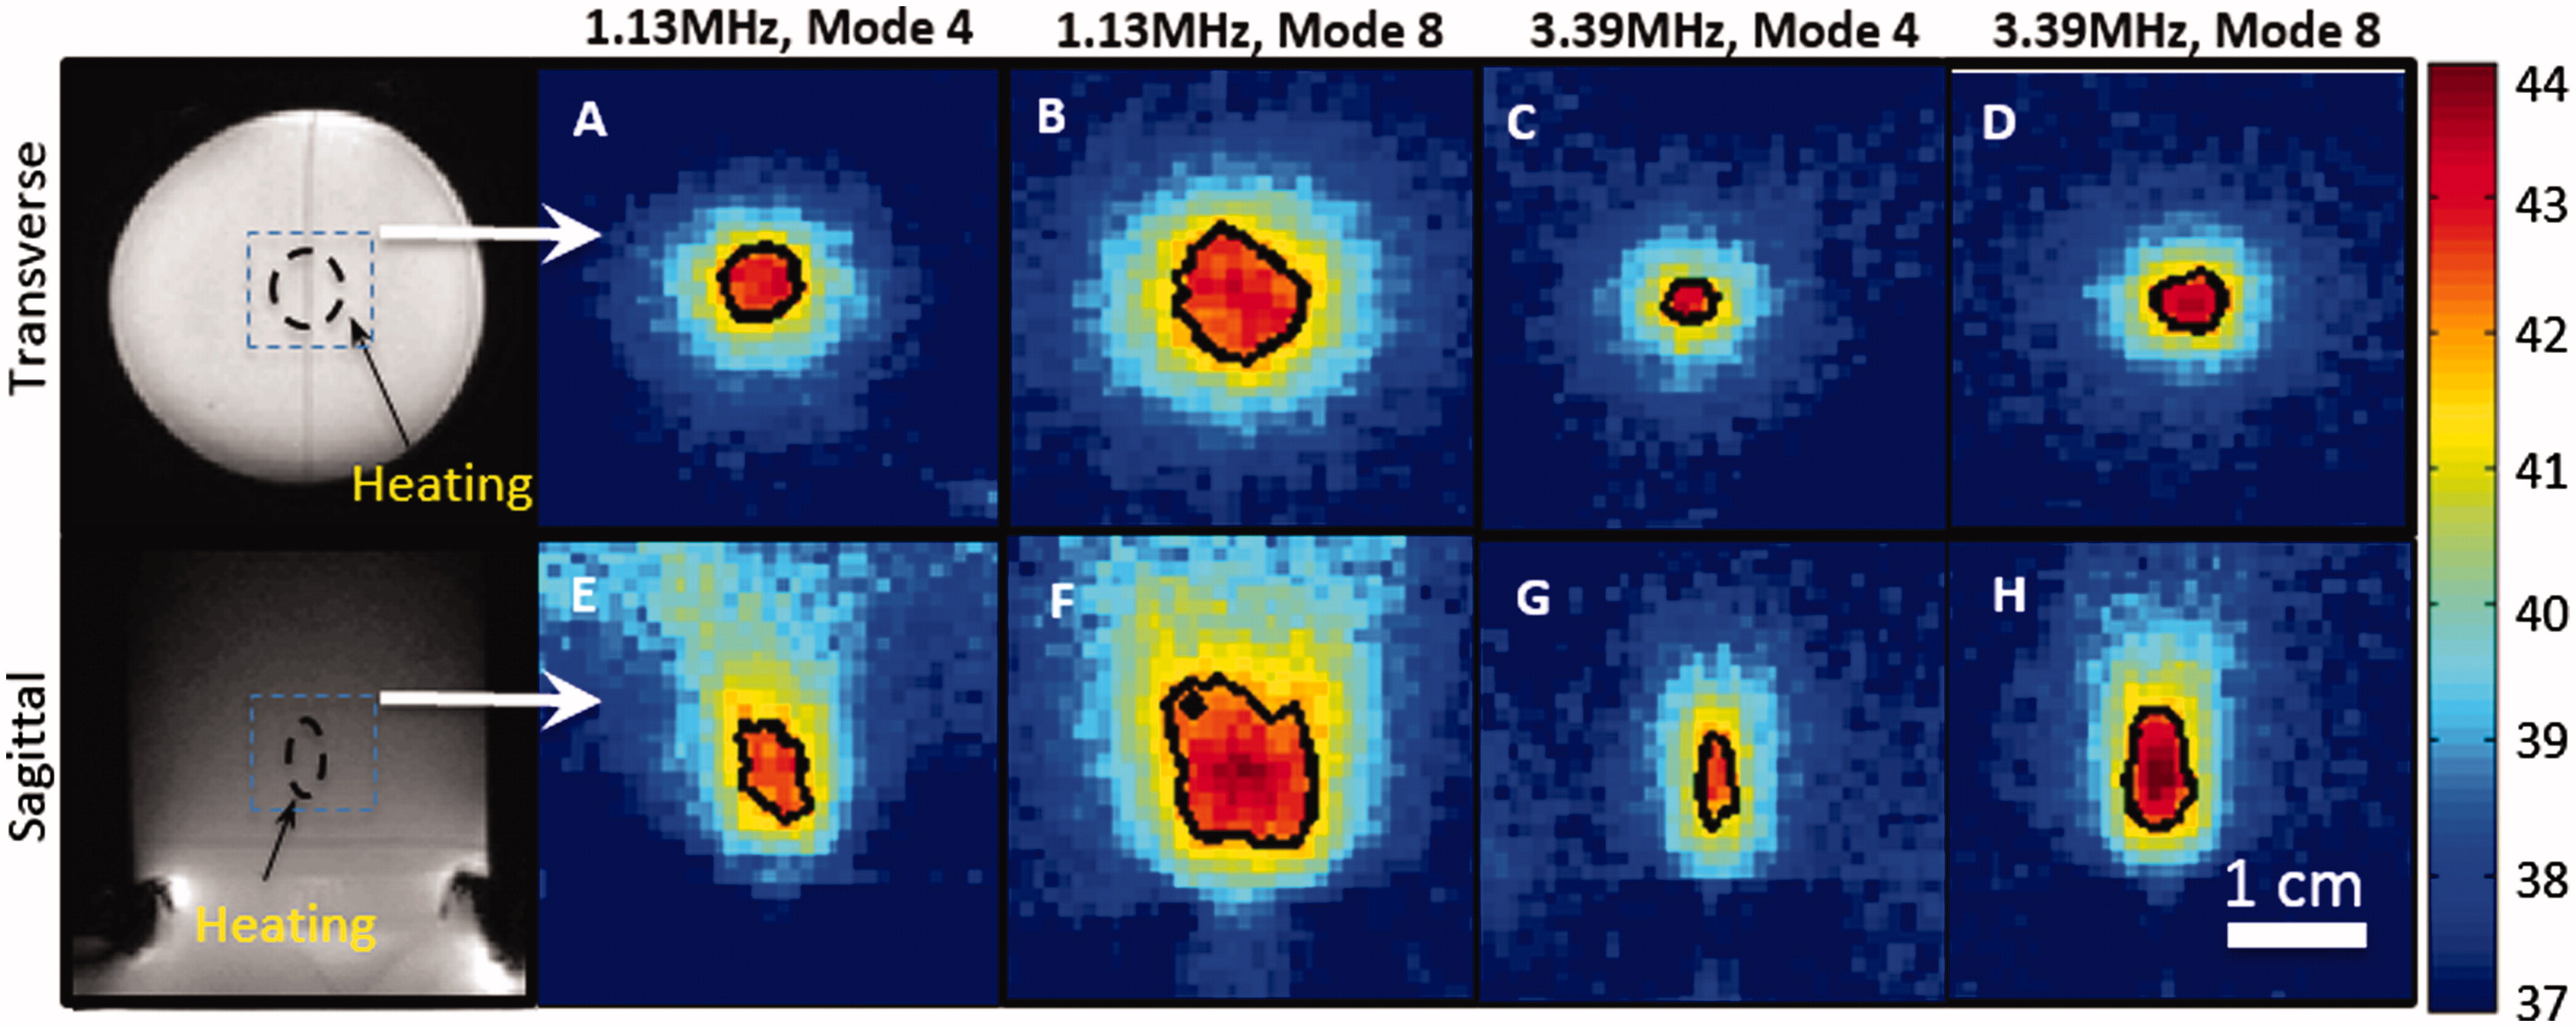
Figure 5. Zoomed-in spatial heating patterns(within the dotted boxes in A, D) measured in a rat thigh with a bare transducer operating at 1.13MHz (B, E) or a mode 4 lens operating at 3.39 MHz (C, F). The temperature maps were acquired at 10 min after sonication. The top panels show the heating transverse to the beam in the focal plane, and the bottom panels show the heating along the beam. Panels A and D depict the process of treatment planning and the location of heating ROI. The black contour indicates the 42 _C isotherm.
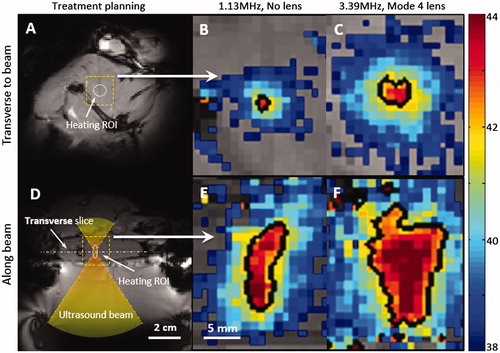
Figure 6. The temperature maps acquired at different time points during the in vivo experiment. Nine time points were selected to represent pre-treatment, during treatment and post-treatment, separately. The black contour showed the 42 °C isotherm. Uniform heating pattern was observed during the treatment. Post-treatment maps indicated that no undesired heating was created within the surrounding tissue.
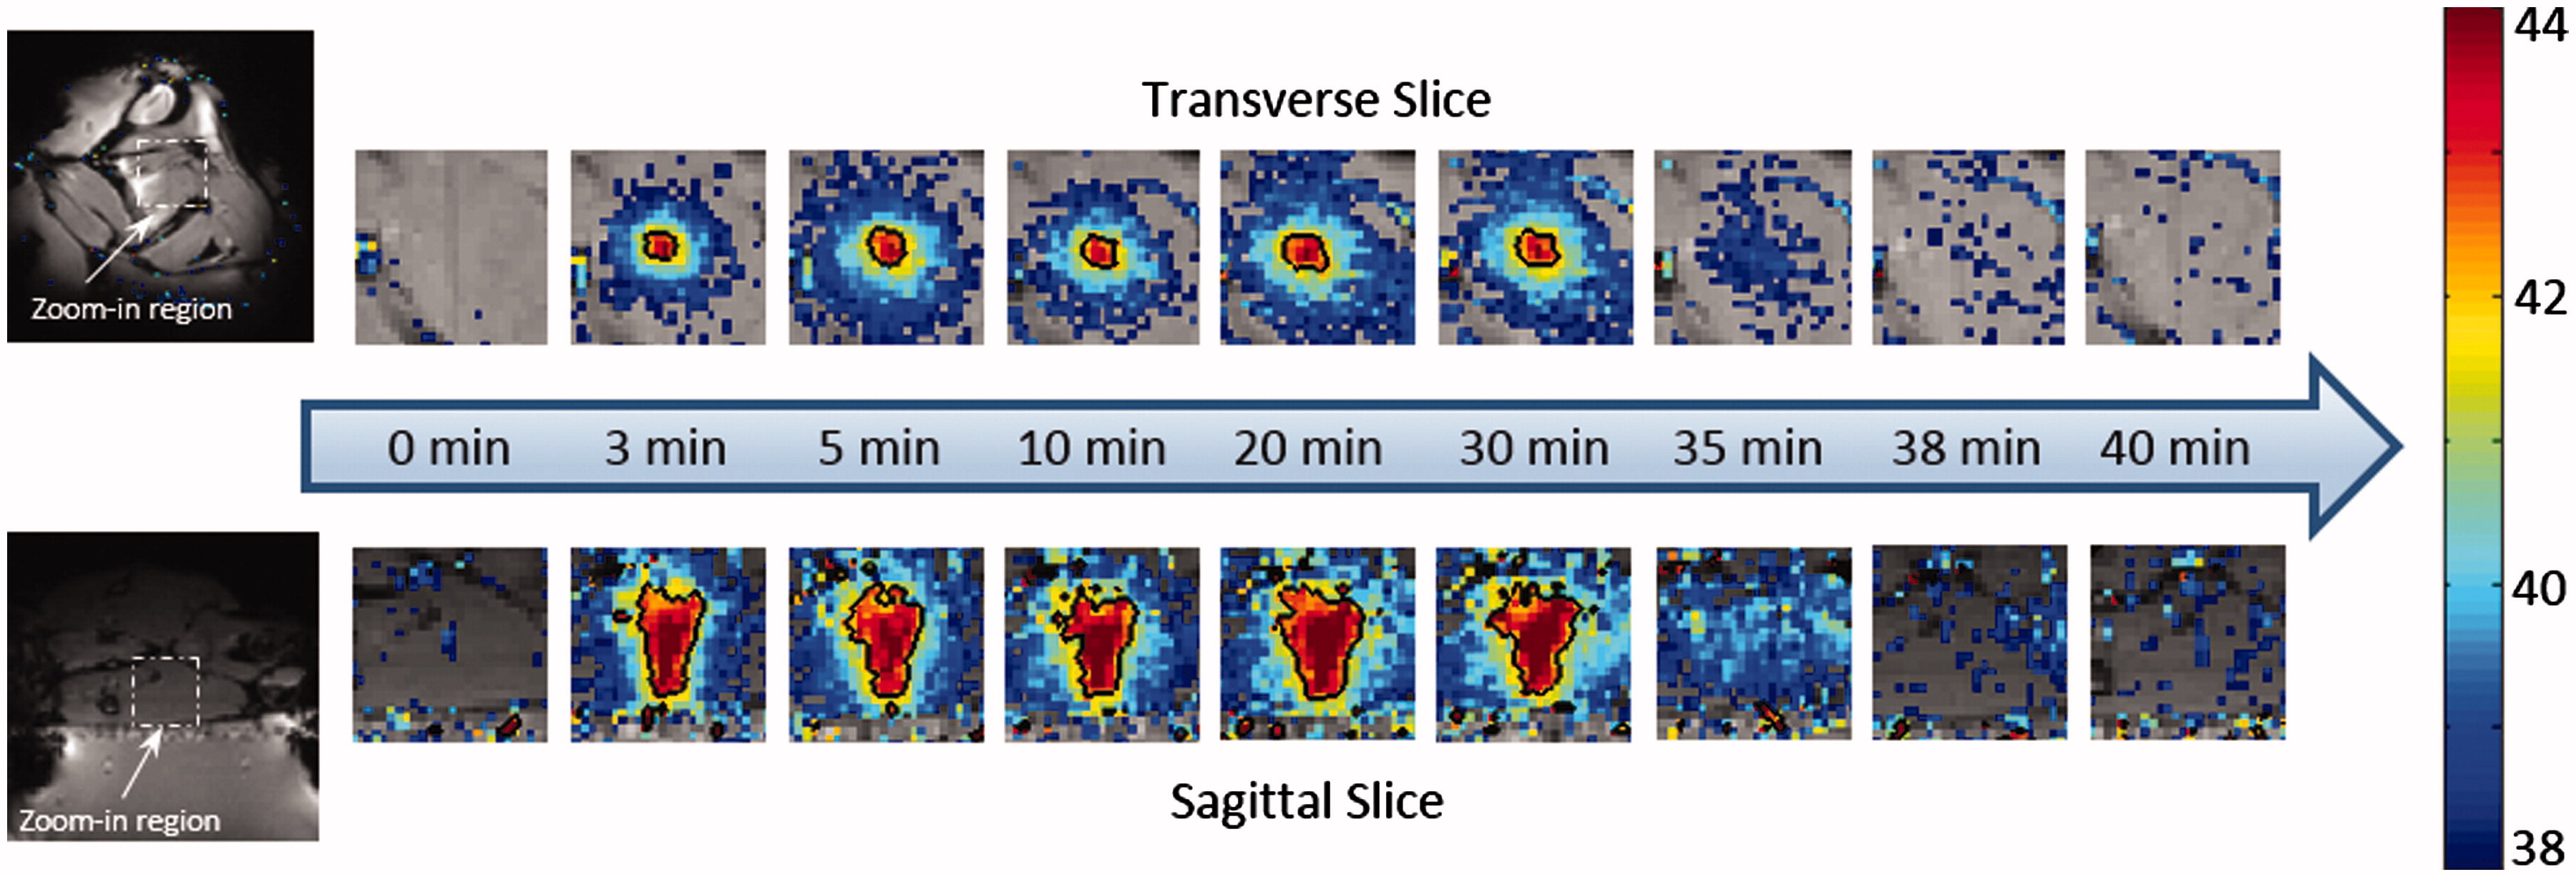
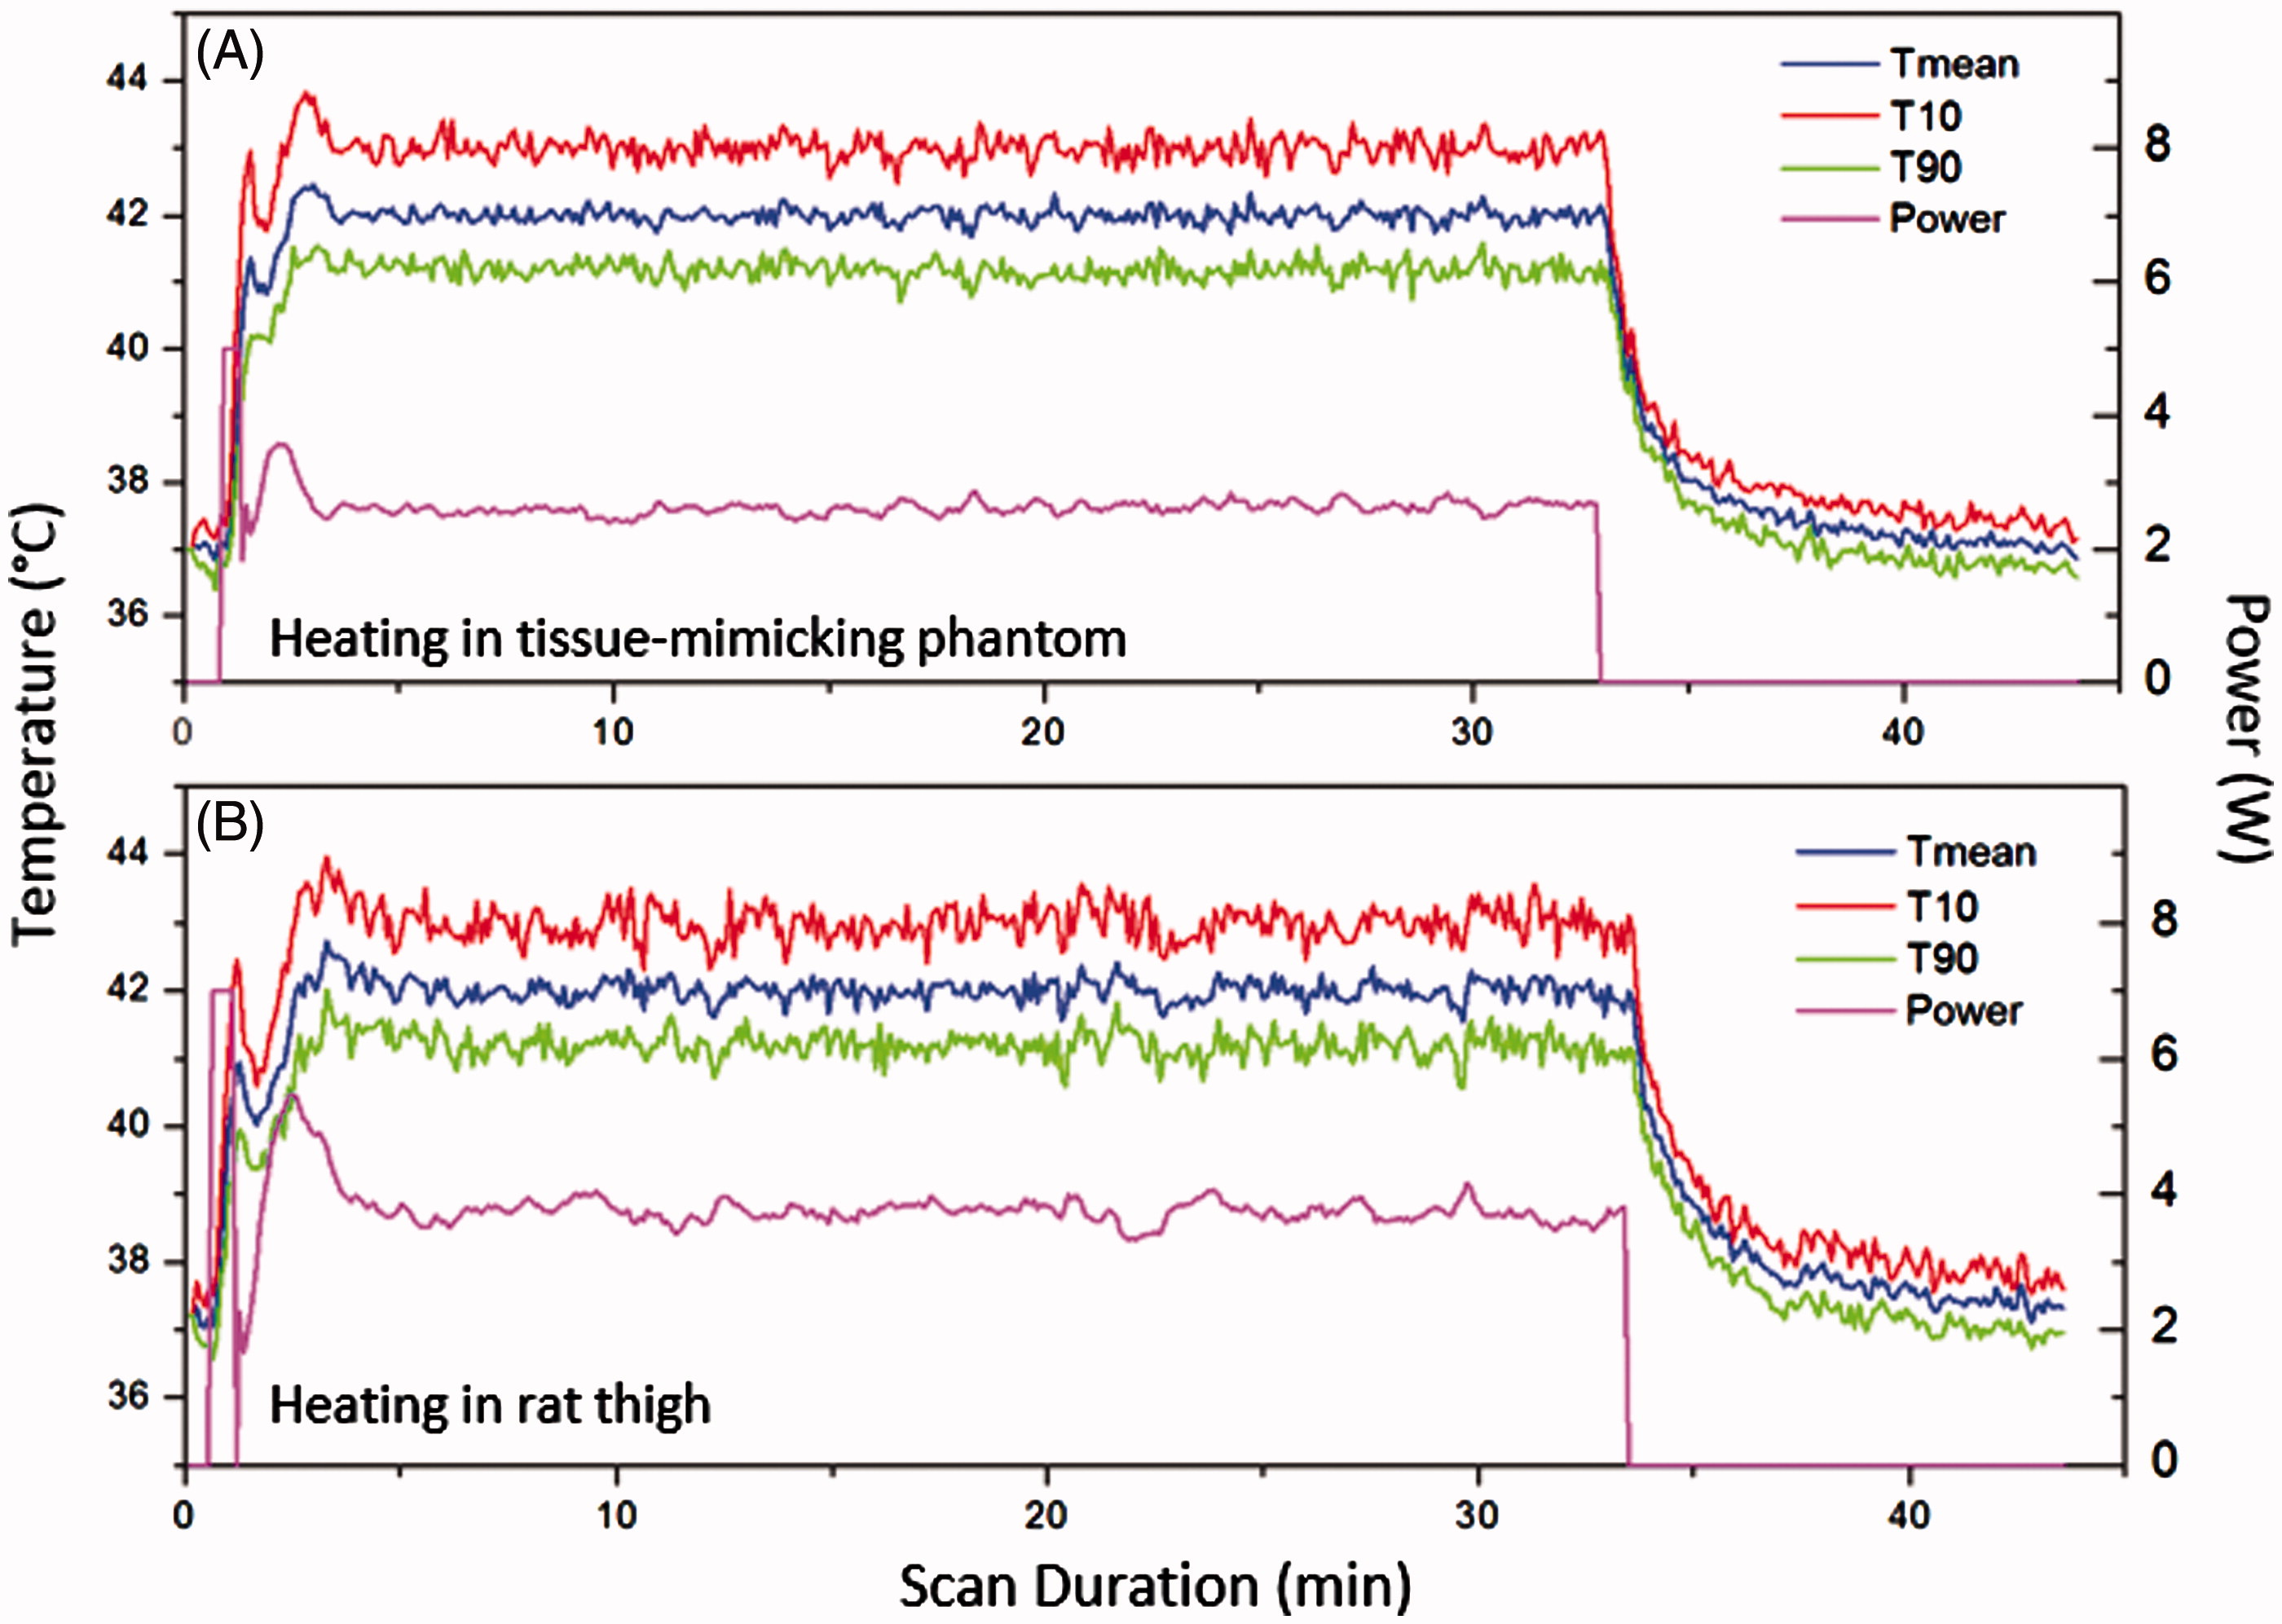
Figure 7. The mean, 10th and 90th percentile temperatures versus time in a central ROI within a tissue-mimicking phantom (A) and rat thigh (B). The output power versus time is also shown for each experiment. Very stable heating was achieved throughout the hyperthermia experiment.