Figures & data
Table 1. Mean demographic data of the subjects who enrolled in the study (n = 12).
Figure 1. Temperature measurements of the abdominal area were repeated immediately after the first modulated electro-hyperthermia and ranged from 39.8–40.9 °C (mean 40.5 °C), indicating an average surface temperature increase of 4 °C.
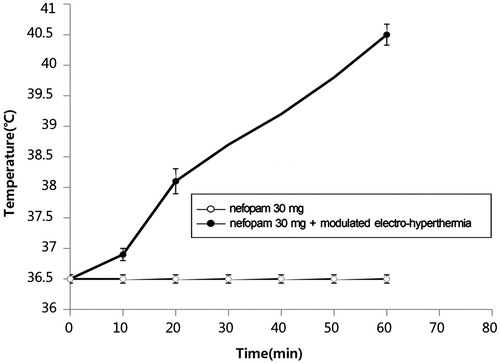
Table 2. The temperature of the abdominal area of participants who underwent modulated electro-hyperthermia (n = 12).
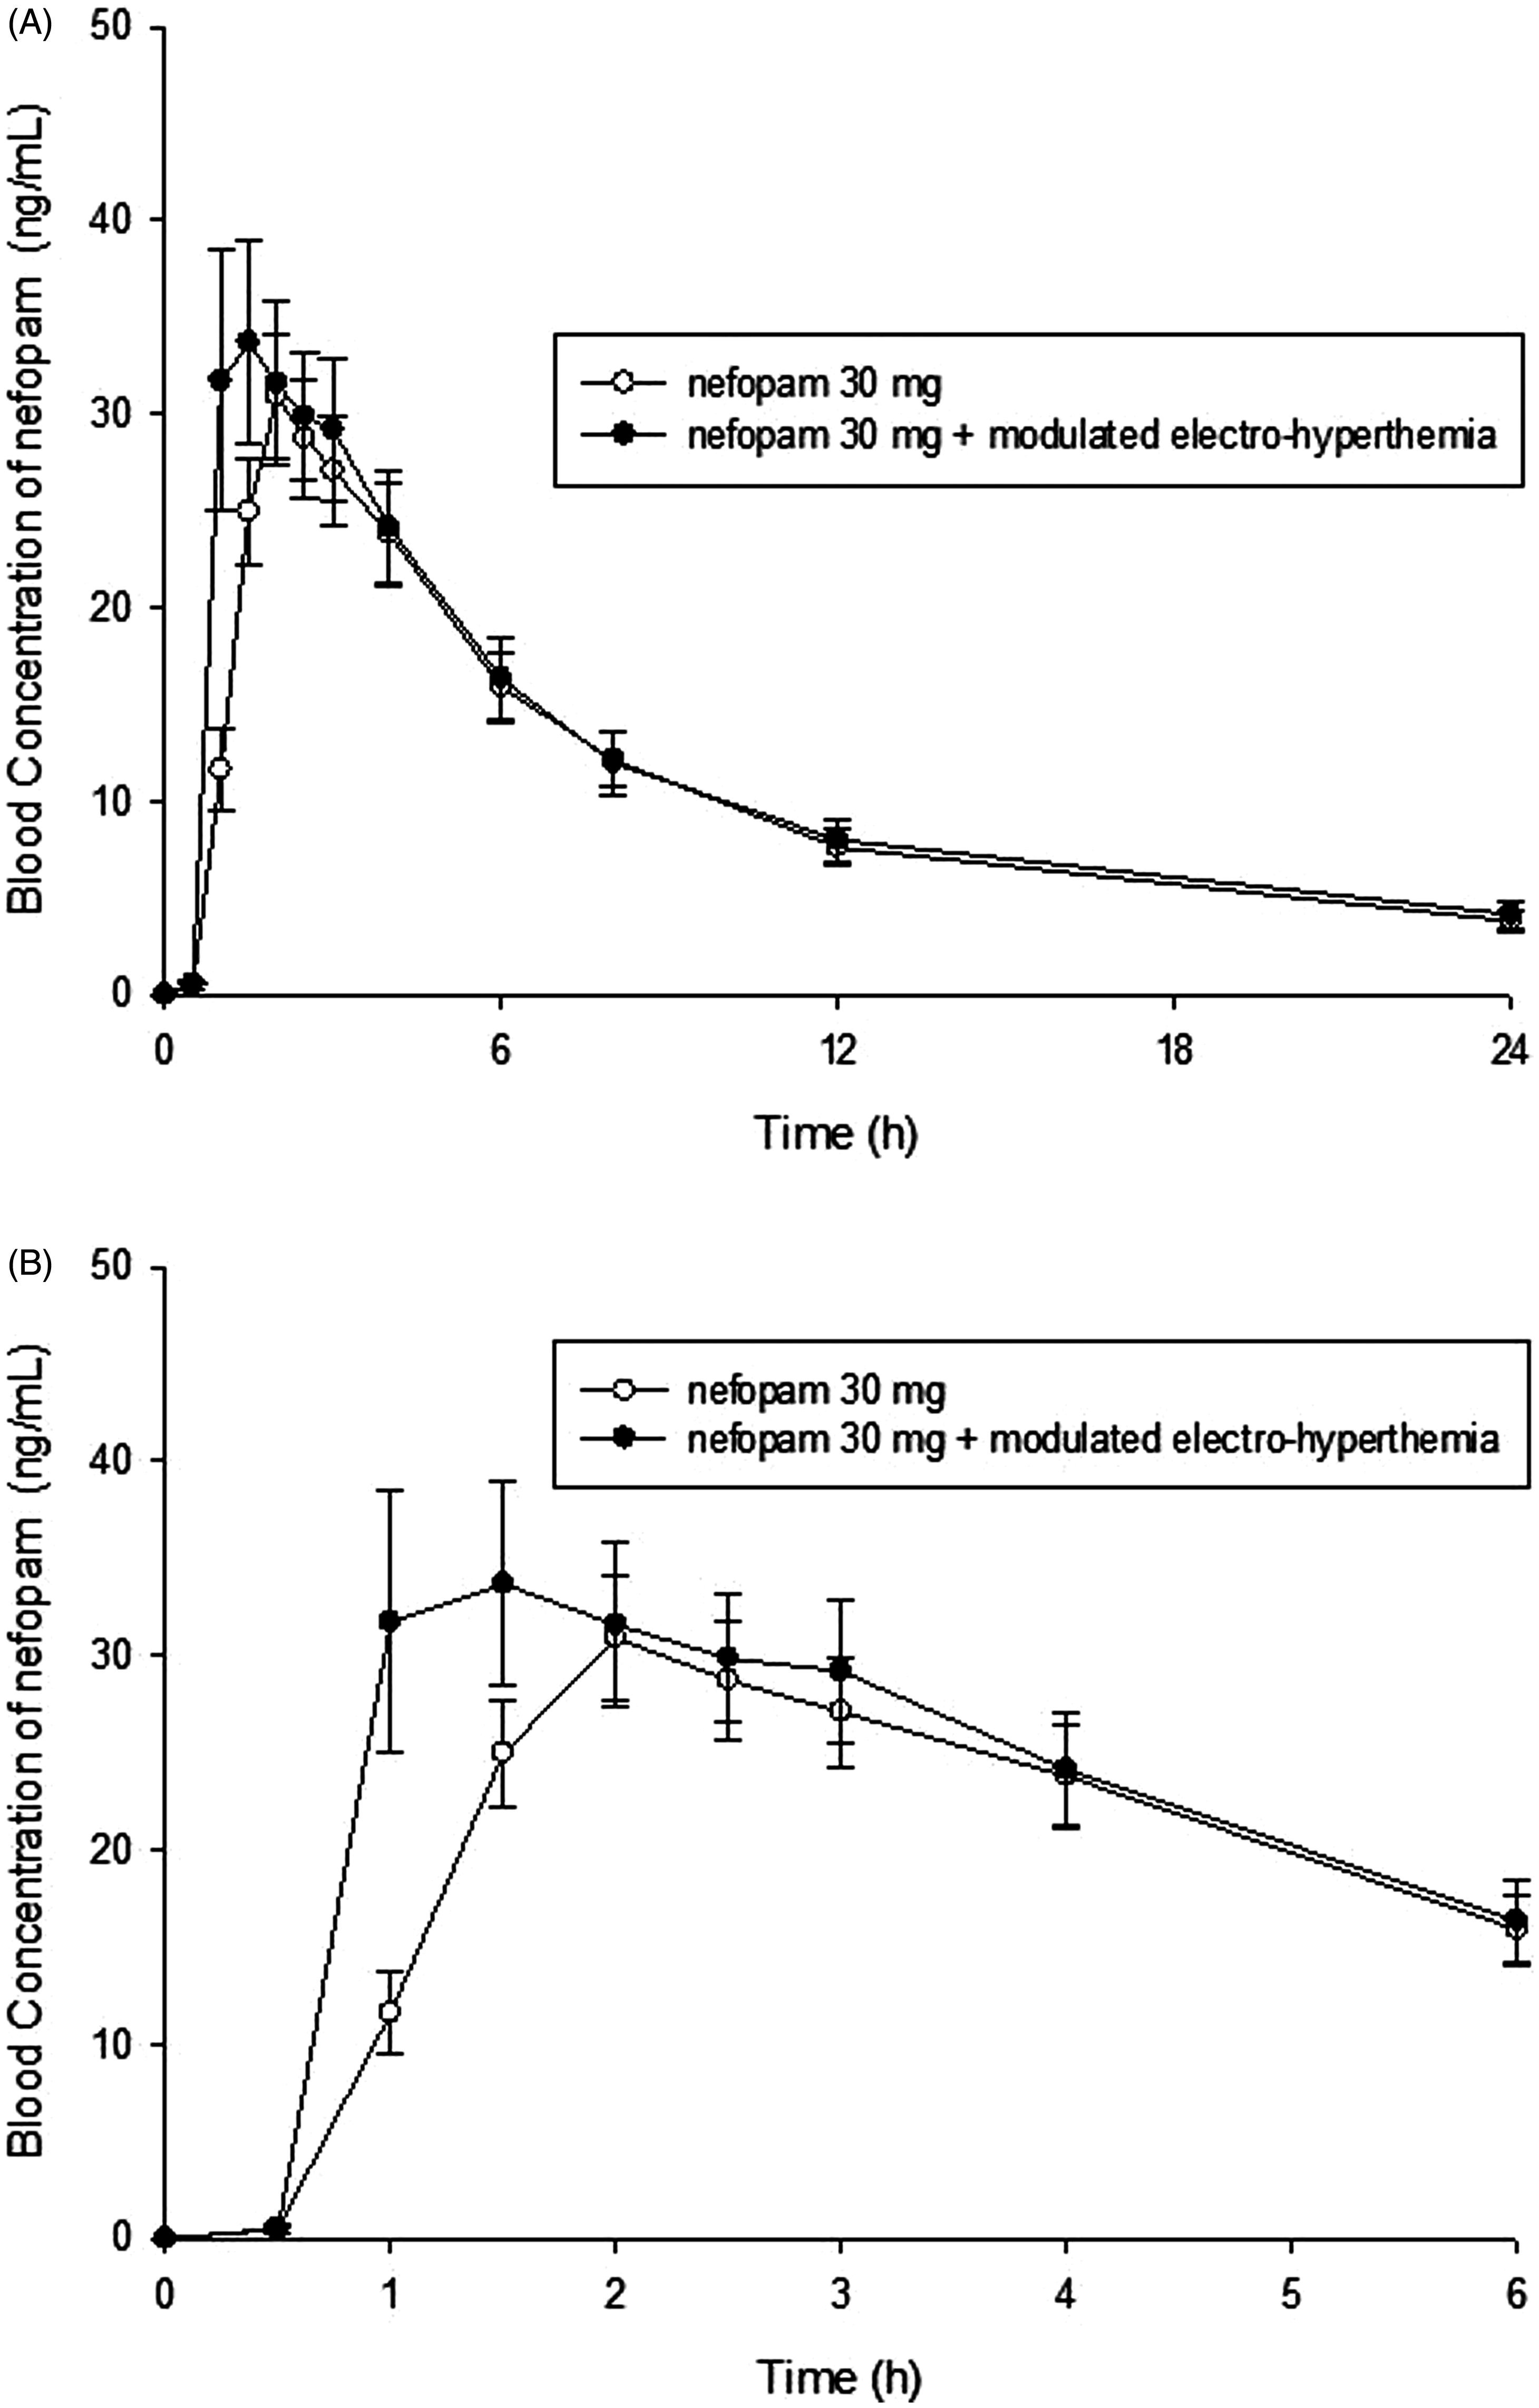
Figure 2. (A) The mean plasma concentration-time profiles of nefopam after the uptake of nefopam alone or in combination with modulated electro-hyperthermia. The data are presented as means ± standard error. (B) The mean plasma concentration-time profiles of nefopam after the uptake of nefopam alone or in combination with modulated electro-hyperthermia from 0 h to 6 h.