Figures & data
Figure 1. Illustration of our calculated ratios through the example of a 54-year old man with an undifferentiated sarcoma in the right upper leg. (A) Contrast-enhanced planning CT scan in prone position clearly demarcates the vascularised tumour from the surrounding muscles. (B) Ratio 1 describes the proportion of the intratumoural catheter length (blue line) compared to the maximum tumour diameter in continuation of the catheter position (red line). In this example ratio 1 = 2.23:2.96 cm = 0.75. (C) Ratio 2 describes the proportion of the intratumoural catheter length (blue line in B) compared to the maximum total tumour diameter in any plane. In this example we reconstructed the coronary image via syngo.via® software (Siemens) because the maximum tumour extent is in this plane (white line). Here ratio 2 = 2.23:5.44 cm = 0.41.
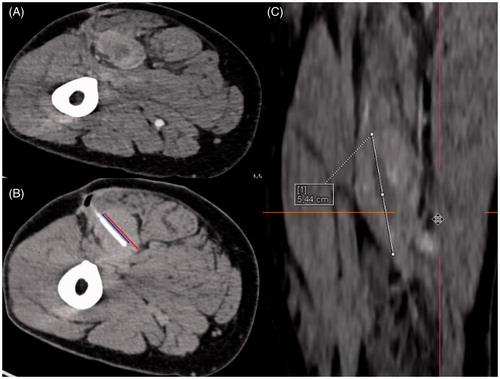
Table 1. Population characteristics in patients with STS undergoing CT fluoroscopy-guided closed-tip catheter placement (N = 35).
Table 2. Characteristics of CT fluoroscopy-guided closed-tip catheter placement.
Table 3. Technical outcome.
Figure 2. Closed-tip catheter placement in a 41-year old mn with a retroperitoneal malignant peripheral nerve sheath tumour (MPNST) (A) Contrast-enhanced planning CT scan shows the extent of the tumour in right psoas muscle. (B) Coronal reconstruction. (C) Intra-interventional CT fluoroscopy image. Final position of the closed-tip catheter.
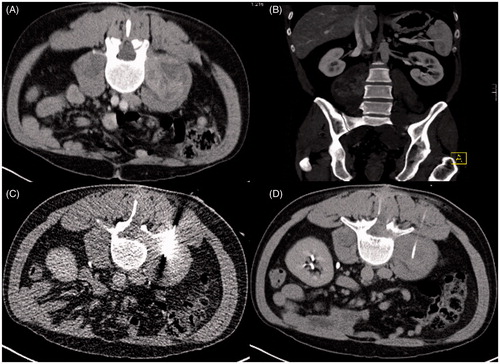
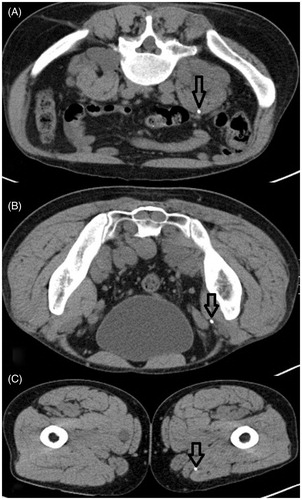
Figure 3. Severe catheter dislocation in the same patient mentioned in . (A–C) Catheter dislocated from its original retroperitoneal intratumoural position down to the upper leg along the fascial space. Arrows indicate the position of the catheter.