Figures & data
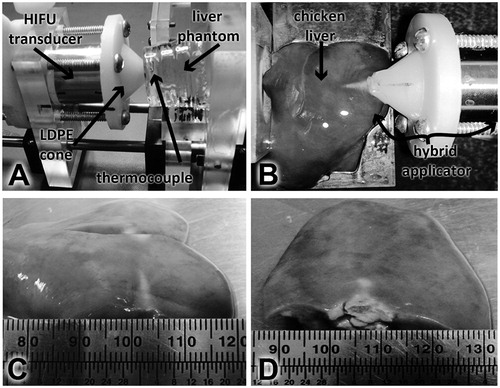
Figure 1. Set-up for the acoustic characterisation of the transducer HIFU. The transducer was fixed inside a bi-distilled and degassed water tank to obtain its radiation pattern by means of the PZTZ44-0400 hydrophone, scanned with a 3D automatic system.
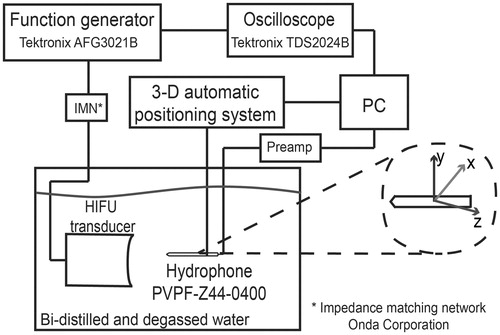
Figure 2. 2D axis-symmetric FEM geometry used to model the acoustic propagation in water. The subdomain represents the propagating medium, water. Boundary 1 is the symmetry axis, boundaries 2 and 3 were configured as the impedance condition, and boundaries 4 and 5 were set as a rigid baffle and as the acoustic radiator, respectively. Radiator radius is 10 mm.
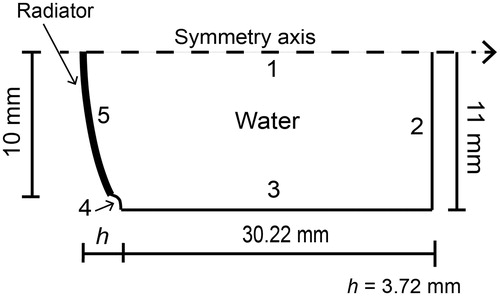
Table 1. HIFU transducer nominal characteristics given by the manufacturer.
Figure 3. Hybrid applicator proposal for acoustic haemostasis and FEM geometry for field modelling. (A) Low density polyethylene (LDPE) cone filled with polyacrylamide (PAA) gel as the acoustic coupling medium to deliver ultrasound energy to the target. (B) Acoustic propagation modelling for the applicator. Boundaries 1 and 2 were set as the symmetry axis. Boundaries 3–5 were configured as the liver impedance condition, and boundaries 6–10 were set as air impedance condition to simulate a haemostasis application. Boundaries 6–10 were configured as the water impedance condition for further comparison with the acoustic characterisation of the applicator. Boundary 11 represents the transducer surface.
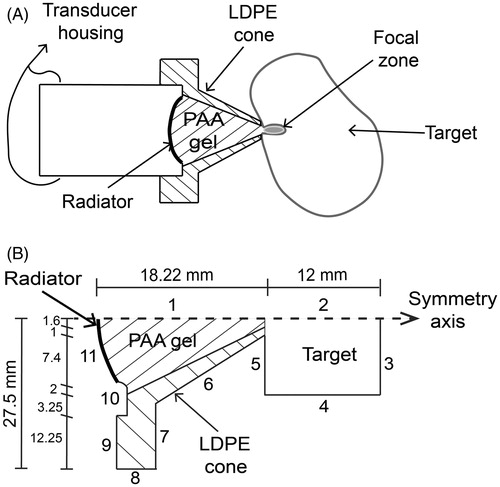
Table 2. Acoustic properties of the materials used for the applicator.
Figure 4. SWR and induced temperature measurement. (A) SWR measurement at low power with the hybrid applicator radiating in air. (B) SWR measurement during experimentation to assure electrical coupling. Temperature increment measurement during experiments with a thermocouple placed at the focus.
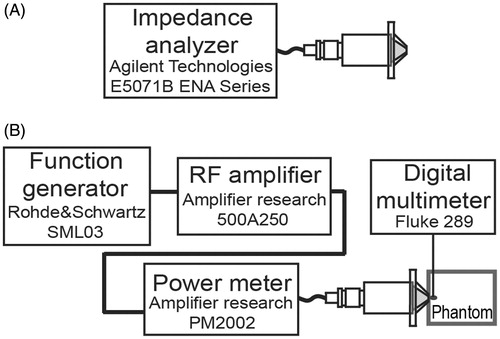
Figure 5. Modelled and measured acoustic radiation patterns of the HIFU transducer. (A) HIFU acoustic fields over propagation xz-plane from FEM model. (B) Experimental measurement in xz-plane. (C) xy-plane pressure at focus (∼20 mm) by FEM simulation. (D) Transversal plane pressure at focus by acoustic characterisation. All data were normalised.
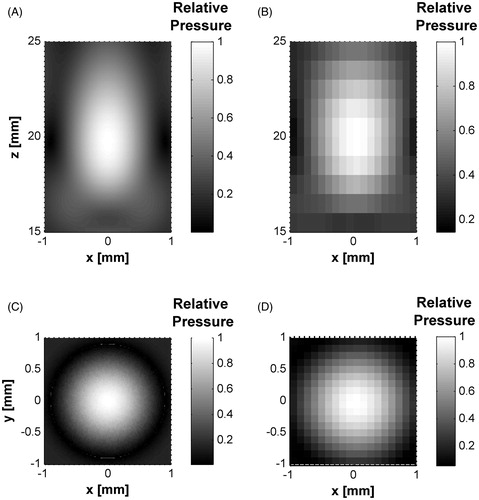
Figure 6. Measured and simulated data comparison for z-axis and sectional planes in the HIFU transducer. (A) Axial pressure distribution measured and simulated for the transducer acoustic field in water. Measured data were obtained from hydrophone scans starting at 2 mm from the edge of the housing. (B) Transversal plane contours at focus (∼20 mm). (C) Propagation plane contours at focal zone. Contours data were normalised.
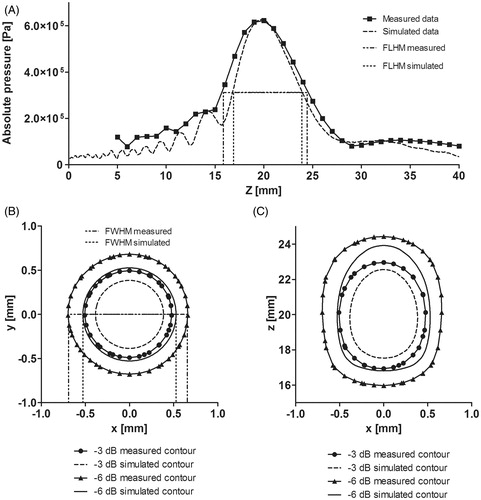
Table 3. Enclosed areas and percentage values between normalized −3 dB and −6 dB pressure contour in the acoustic fields (measured and simulated).
Figure 7. Pressure distribution along beam path from measured and simulated data. (A) Absolute values of the pressure distribution with only the HIFU radiator, and the haemostatic applicator simulation when it was immersed in water and with extracorporeal usage. (B) Normalised pressure distribution of the measured and simulated data.
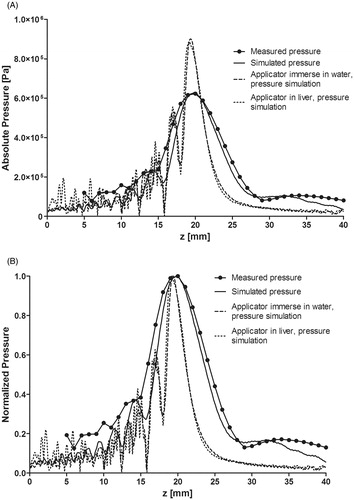
Figure 8. Temperature dependence of sound speed measured for the gels and the low density polyethylene. Left vertical axis: Sound speed temperature dependence for the low density polyethylene material (used for the cone). Right vertical axis: Temperature dependence of the 10% polyacrylamide gel (coupling medium) and 7% polyacrylamide +9% bovine serum albumin gel (liver phantom).
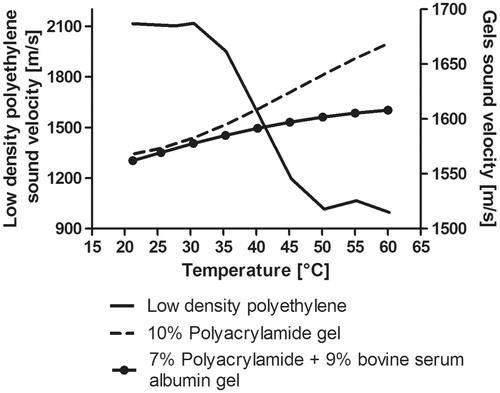
Figure 9. Hybrid applicator acoustic pattern from the cone tip. (A) Modelled acoustic field, (B) measured acoustic field. Some pressure beam variation can be seen between the modelled and measured fields which could be due to the non-ideal lateral radiations and the effective acoustic coupling between the materials: low density polyethylene, 10% polyacrylamide gel and water.
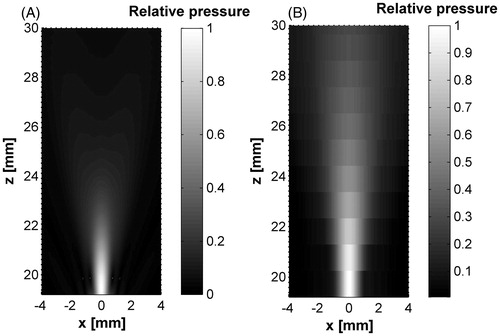
Figure 10. Experimental set-up for induced temperature measurement inside the liver phantom and ex vivo experimentation. (A) Hybrid applicator set-up for temperature measurement in the liver phantom. (B) Hybrid applicator set up for ex vivo experimentation. (C) HIFU effects in chicken liver at 10 W. (D) HIFU effects in chicken liver at 20 W.