Figures & data
Figure 1. Experimental setup for the in vivo drug delivery experiments. (a) The animal was placed on its side on the MR-HIFU platform with one thigh in the path of a focused ultrasound beam. (b) A transverse MR image through the thigh shows the location of heating in the dashed circle. (c) A sagittal MR image along the path of the ultrasound beam shows the location of heating in a perpendicular plane. The relationship between both images is illustrated with the white dashed lines.
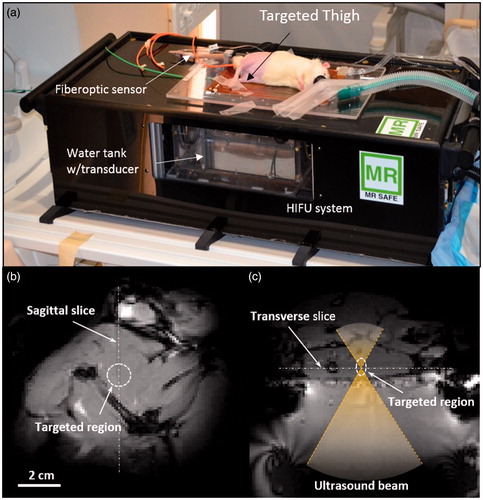
Figure 2. (a, b) Thermoscan assay in physiological buffer between 25–42 °C. Release of ciprofloxacin from LTSL was relatively greater in serum than in PBS. (c, d) Ciprofloxacin release kinetics; (c) Less than 20--30% ciprofloxacin release was noted from 25--39 °C upon incubation for 15 min in PBS; (d) In contrast, 30--60% release was noted in serum from 25--39 °C upon incubation for 15 min in FBS.
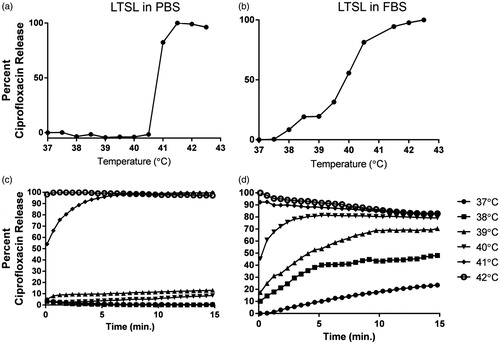
Figure 3. (a) Evaluation of thermosensitive release and killing of S. aureus by disc diffusion method. (b) A significantly greater zone of inhibition was noted when LTSL was heated to 42 °C compared to 37 °C (**p < 0.05, unpaired t-test).
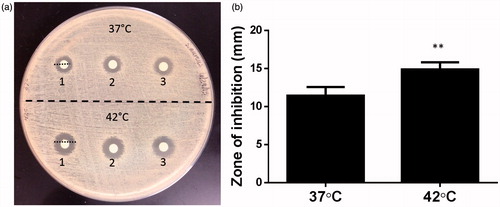
Figure 4. S. aureus survival following treatment of 5-day-old biofilms with free ciprofloxacin and LTSL at 37 and 42 °C (2.7–350 µM). At lower concentrations (2.7–44 µM), significant killing of S. aureus was noted for Cipro-LTSL and free ciprofloxacin at 42 °C compared to body temperature (p < 0.05, Tukey’s multiple comparison). At the super-saturated concentrations (>50 µM), similar survival was noted for all the groups.
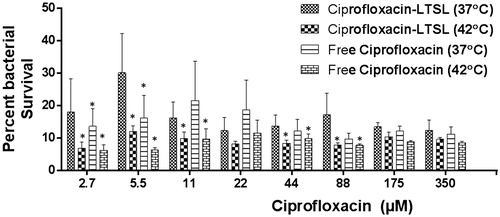
Figure 5. (a) Scanning electron micrograph of a Staphylococcus biofilm on the PEG of the MBEC biofilm device (arrow). (b) Biofilms treated at 37 °C with LTSL shows the presence of extracellular matrix substances, surrounding and encasing spherical S. aureus (arrow). (c) Biofilms treated at 42 °C with LTSL suggest a loss in the granularity of the matrix (arrow), and deformation of bacterial membrane.
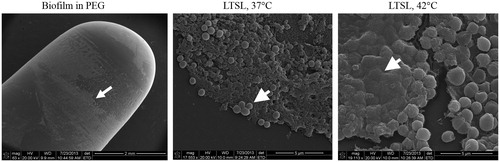
Figure 6. Temperature maps and measurements during treatment. (a) Temperature maps in two perpendicular planes at different time points (0, 10, 20, 30 and 40 min). The black contour is the 42° isotherm which corresponds well to the desired treatment region. (b) Mean, T90, and T10 temperatures within the target ROI. A tight temperature range was achieved and the body temperature curve confirmed the effectiveness of the warming tray.
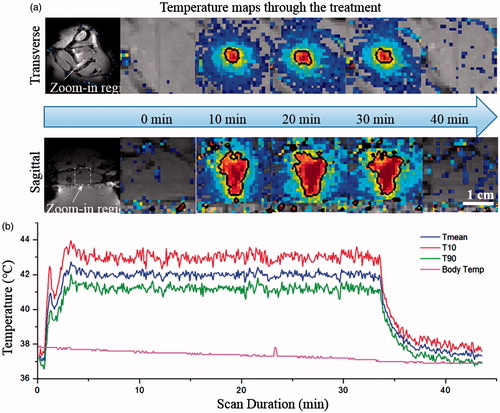
Figure 7. Biodistribution of ciprofloxacin in rats following treatment with ciprofloxacin + MR-HIFU or LTSL + MR-HIFU at a dose of 10 mg/kg administered i.v. Data are shown as mean ciprofloxacin concentration in the indicated tissues with standard error of mean (n = 3). *Free ciprofloxacin versus LTSL, p < 0.05, Tukey’s multiple comparison).
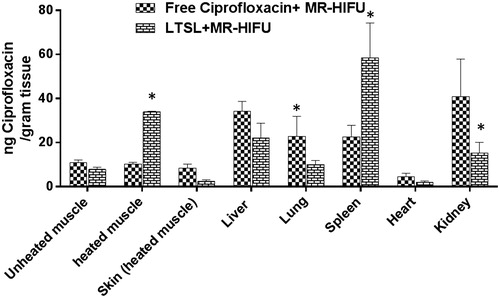
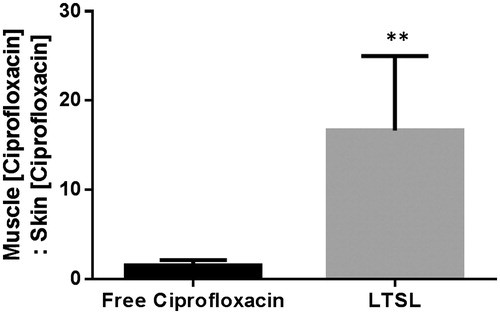
Figure 8. Specificity of drug delivery shown by relative ciprofloxacin concentration in rat superficial/deep thigh muscle as compared to adjacent muscle following treatment either with free ciprofloxacin or LTSL + MR-HIFU at a dose of 10 mg/kg ciprofloxacin. Data are shown as ratio of muscle (ciprofloxacin):skin (ciprofloxacin) with standard error of mean (n = 3). **p < 0.05.