Figures & data
Figure 1. Normal anatomy of the porcine pancreas and the surgical procedure after the first section of the pancreas according to Ferrer et al. [Citation12]. The ‘splenic’ lobe (SL), corresponding to the tail and body in the human pancreas, is attached to the spleen. The ‘duodenal’ lobe (DL), corresponding to the head of the pancreas, is located adjacent to the duodenum while the ‘connecting’ lobe (CL), corresponding to the uncinated process is an extension of the pancreas which is anterior to the portal vein (PV). There is also a ‘bridge’ (B) of pancreatic tissue serving as an anatomical connection between the splenic and connecting lobes behind the portal vein. In order to achieve a complete separation of the distal part (body and tail) two transection planes were performed (numbers 1 and 2) with the transection device (TD) (either RF electrode or mechanical stapler).
![Figure 1. Normal anatomy of the porcine pancreas and the surgical procedure after the first section of the pancreas according to Ferrer et al. [Citation12]. The ‘splenic’ lobe (SL), corresponding to the tail and body in the human pancreas, is attached to the spleen. The ‘duodenal’ lobe (DL), corresponding to the head of the pancreas, is located adjacent to the duodenum while the ‘connecting’ lobe (CL), corresponding to the uncinated process is an extension of the pancreas which is anterior to the portal vein (PV). There is also a ‘bridge’ (B) of pancreatic tissue serving as an anatomical connection between the splenic and connecting lobes behind the portal vein. In order to achieve a complete separation of the distal part (body and tail) two transection planes were performed (numbers 1 and 2) with the transection device (TD) (either RF electrode or mechanical stapler).](/cms/asset/0158d953-28b9-49eb-8cab-efa116aa2b13/ihyt_a_1136845_f0001_c.jpg)
Table 1. Intra- and post-operative variables of each experimental group.
Table 2. Detailed information on the clinical progress of the animals studied.
Figure 2. Main findings in the pancreas previously transected at the neck level: 1) pancreatic leak (related to the exit of main pancreatic duct) with no signs of atrophy; 2) Pseudocyst (also related to the exit of the main pancreatic duct) accompanied by partial atrophy (score 2 to 3) of the distal pancreas; and 3) Complete atrophy (score 5) of the distal zone, which occurred mostly in the cases without incidence of pancreatic fistula formation (POPF), i.e. in cases in which effective sealing of the pancreatic ducts can be expected.
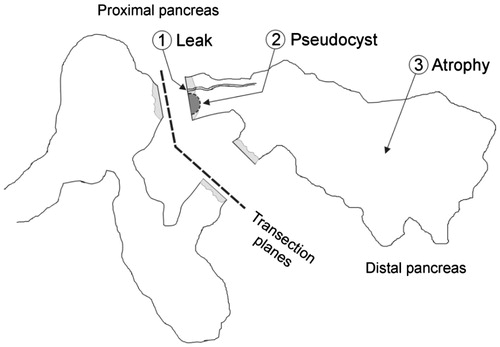
Figure 3. Macroscopic and microscopic patterns founded in the distal remnant pancreas: 1) Pancreatic leak (broken arrow, A1) from the distal stump observed in animal 4 of the ST group that died on day 2 PO. The origin of the leak was easily canalised with a probe (broken arrow, A2) between some staples (arrowhead). Histologically no signs of atrophy were described (A3); 2) Pseudocyst (open arrow, B1) accompanied by partial atrophy (B2) in the distal pancreas; 3) Complete atrophy of the distal remnant pancreas (C1, C2). This occurred mostly in the RF group, in which an area of coagulative necrosis was always observed (arrow). In any case, the proximal pancreas was well preserved with no signs of atrophy (asterisk).
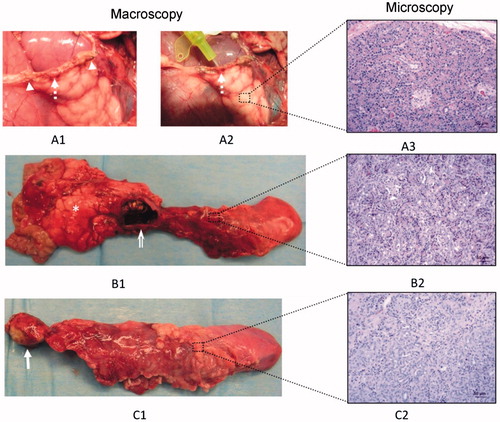
Figure 4. Common histological features of complete atrophy. The main pancreatic duct (arrow) is dilated and provided with a thick fibrotic wall. The acinar component of the pancreatic tissue has completely disappeared (atrophy score 5) and is replaced by lobules (#) of pseudo-ductal complexes with some dilated ducts (arrowheads). In these lobules, islets of Langerhans were easily seen (broken arrows). In between these lobules, there was marked interlobular adipose infiltration (asterisk).
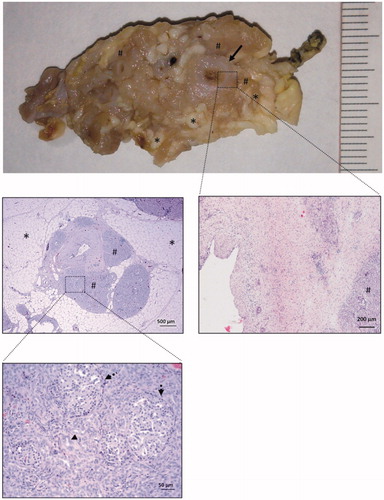
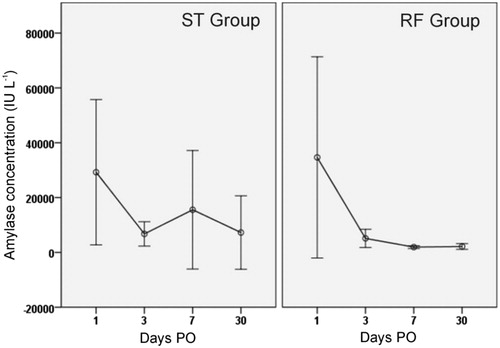
Figure 5. Peritoneal liquid amylase concentration throughout the postoperative period in both groups. Circles indicate mean values and each segment denotes 95% confidence interval of values. Note that values in the RF group are usually lower and homogeneous beyond day 3 PO.