Figures & data
Figure 1. IHC staining of Caspase-3 ×100 ACEG took place at the 4 h time point after treatment, and BDFH staining at the 24 h time point. (A, B) Negative expression of cleaved caspase-3 in the control group. (C, D) Weak positive cleaved caspase-3 expression in the necrotic region of the DOX group. (E, F) Weak positive cleaved caspase-3 expression at the coagulation margin of the 20W-MWA group. (G, H) Positive cleaved caspase-3 expression at 4 h and a strong positive expression at 24 h at the coagulation margin in the DOX-MWA group.
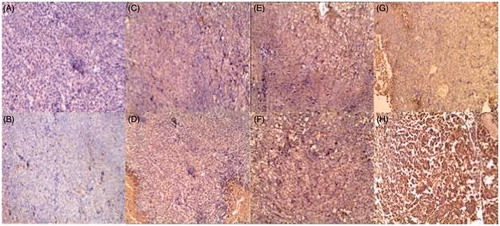
Figure 2. IHC staining of Hsp70 × 100 ACEG took place at the 4 h time point after treatment, and BDFH staining at the 24 h time point. (A, B) Negative Hsp70 expression in the control group. (C, D) Weak positive Hsp70 expression at the necrotic region of the DOX group. (E, F) Positive Hsp70 expression at 4 h and a strong positive expression at 24 h at the coagulation margins of the 20W-MWA group. (G, H (Weak Hsp70 expression in the DOX-MWA group.
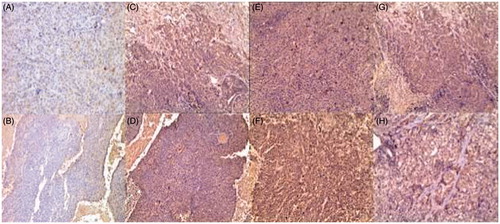
Figure 3. Expressions of Hsp70 and cleaved caspase-3 at 4 h and 24 h after treatment. Western blot results of (A) Hsp70, and (B) cleaved caspase-3 at the coagulation or necrosis margins of the tumour tissues. Significant differences in the relative intensity of Hsp70 and cleaved caspase-3 were detected between the DOX group and 20W-MWA and DOX-MWA groups. The results are displayed as the mean, and the error bars denote SD; n = 6 for each group; p < 0.05. Significant differences in Hsp70 and cleaved caspase-3 were detected between the 20W-MWA and DOX-MWA groups at 24 h after treatment. The DOX-MWA level of Hsp70 was lower than 20W-MWA at 24 h after treatment; however, the DOX-MWA levels of cleaved caspase-3 were significantly higher. *p > 0.05; **p < 0.05; ***p < 0.01.
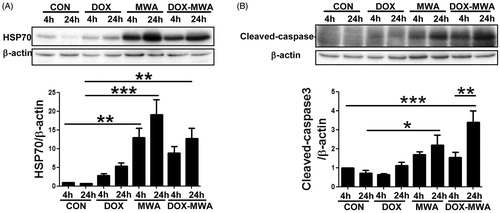
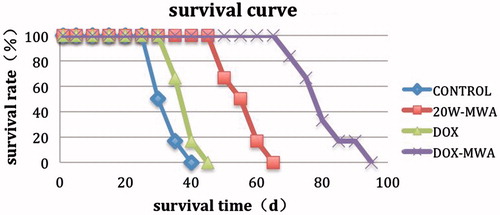
Figure 4. Kaplan–Meier analysis of end-point survival following treatment with MWA and/or IV DOX. Survival end-point signifies the time when the animal refused solid and fluid intake for more than 4 days with a weight loss of more than 20%. The greatest end-point survival was observed with combined therapy, using DOX and MWA. In addition, improved survival was noted in the 20W-MWA group, compared to the DOX group or control group.