Figures & data
Table 1. Primers used for real-time PCR.
Figure 1. The cytotoxicity of PA on IEC-6 cells. PA had no cytotoxic effect on IEC-6 cells in concentrations from 0 to 80 ng/mL. After stimulation with 100 ng/mL of PA for 6, 12 and 24 h, cell viability was significantly inhibited. Data are mean ± SEM, n = 6 per treatment (*p < 0.05 vs. control group; **p < 0.01 vs. control group).
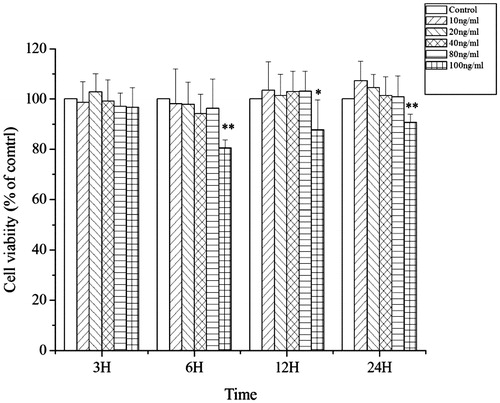
Figure 2. Morphology of IEC-6 cells. In the normal condition, the distribution of IEC-6 cells was compact and regular (A). Heat shock markedly altered IEC-6 cellular morphology; red arrows represent changes in cell shape (B). PA regulated cellular morphology and the arrangements of IEC-6 cells returned to normal. (A) control cells without any processing; (B)heat shock; (C) pretreatment with 10 ng/mL PA + heat shock; (D) pretreatment with 40 ng/mL PA + heat shock; (E) pretreatment with 80 ng/mL PA + heat shock). Scale bar: 50 μm.
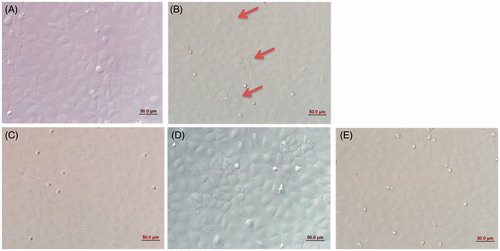
Figure 3. mRNA expression by HSP70 and HSP90 in IEC-6 cells. Compared with the control group, the mRNA expression by HSP70 and HSP90 in the heat shock group was significantly increased. Compared with the heat shock group, PA significantly decreased the mRNA expression by HSP70 (A), PA pretreatment at middle dose (40 ng/mL) and high dose (80 ng/mL) significantly decreased the mRNA expression by HSP90 (B). Control, control cells without any processing; HS, heat shock; Low, pretreatment with 10 ng/mL PA + heat shock; Middle, pretreatment with 40 ng/mL PA + heat shock; High, pretreatment with 80 ng/mL PA + heat shock. Data are mean ± SEM, n = 3 per treatment (**p < 0.01 vs. control group; #p < 0.05 vs. heat shock group; ##p < 0.01 vs. heat shock group).
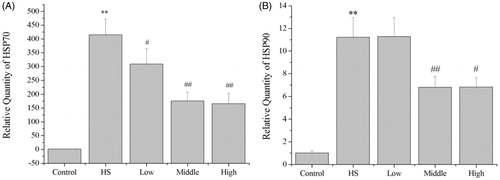
Figure 4. Effects of PA on the generation of intracellular ROS and MDA content in response to heat shock. Generation of intracellular ROS was detected by flow cytometry (A). Compared with the control group, heat shock significantly increased the intracellular ROS. Compared with the heat shock group, pretreatment with PA at 80 ng/mL significantly increased the intracellular ROS (B). Compared with the control group, heat shock significantly increased the MDA content in the supernatant of IEC-6 cells. Compared with the heat shock group, the MDA content in the low (10 ng/mL), middle (40 ng/mL) and high dose (80 ng/mL) of PA pretreatment groups was significantly decreased (C). Control, control cells without any processing; HS, heat shock; Low, pretreatment with 10 ng/mL PA + heat shock; Middle, pretreatment with 40 ng/mL PA + heat shock; High, pretreatment with 80 ng/mL PA + heat shock. Data are mean ± SEM, n = 3 per treatment (*p < 0.05 vs. control group; **p < 0.01 vs. control group; ##p < 0.01 vs. heat shock group).
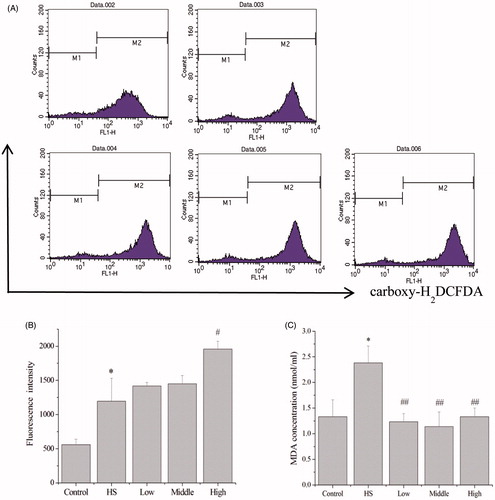
Figure 5. Effects of PA on oxidative stress response. Heat shock did not change the mRNA expression by SOD or CAT, but significantly increased GSH-px mRNA expression. Compared with the heat shock group, PA significantly decreased mRNA expression by SOD, CAT and GSH-px (A–C). Control, control cells without any processing; HS, heat shock; Low, pretreatment with 10 ng/mL PA + heat shock; Middle, pretreatment with 40 ng/mL PA + heat shock; High, pretreatment with 80 ng/mL PA + heat shock. Data are mean ± SEM, n = 3 per treatment (**p < 0.01 vs. control group; #p < 0.05 vs. heat shock group; ##p < 0.01 vs. heat shock group).
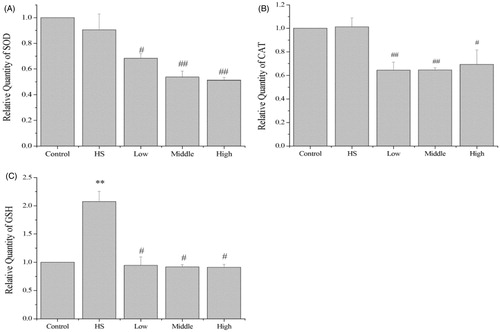
Figure 6. Effects of PA on the mRNA expression by NRF2, KEAP1 and HO-1. Heat shock significantly increased NRF2 and HO-1 mRNA expression in the IEC-6 cells (A and C). However, heat shock did not change KEAP1 mRNA expression (B). Compared with the heat shock group, PA significantly decreased KEAP1 and HO-1 mRNA expression (B and C). Control, control cells without any processing; HS, heat shock; Low, pretreatment with 10 ng/mL PA + heat shock; Middle pretreatment with 40 ng/mL PA + heat shock; High, pretreatment with 80 ng/mL PA + heat shock. Data are mean ± SEM, n = 3 per treatment (**p < 0.01 vs. control group; #p < 0.05 vs. heat shock group; ##p < 0.01 vs. heat shock group).
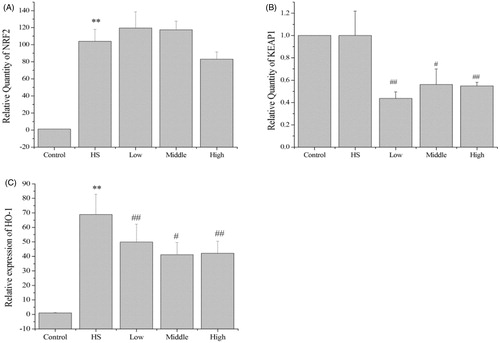
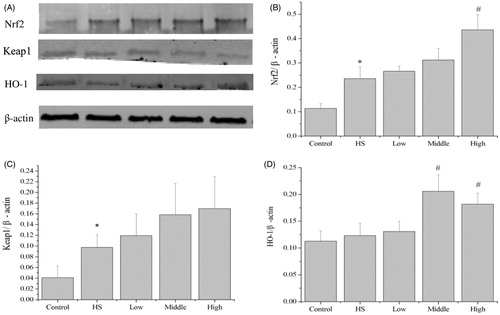
Figure 7. Effects of PA on the protein expression of Nrf2, Keap1 and HO-1. Heat shock significantly increased Nrf2 and Keap1 protein expression (A–C). Compared with the heat shock group, PA at high dose significantly increased (p < 0.05) Nrf2 protein expression (A, B), PA at middle and high doses significantly increased (p < 0.05) HO-1 protein expression (A, D), but PA did not significantly change the protein expression of Keap1 (A, C). Control, control cells without any processing; HS, heat shock; Low, pretreatment with 10 ng/mL PA + heat shock; Middle, pretreatment with 40 ng/mL PA + heat shock; High, pretreatment with 80 ng/mL PA + heat shock. Data are mean ± SEM, n = 3 per treatment (*p < 0.05 vs. control group; #p < 0.05 vs. heat shock group).