Figures & data
Figure 1. MRI images of the sagittal view in patients with adenomyosis. (A, C) T2-weighted images pre-ablation; globally enlarged uterus with local and diffuse widening of junctional zones can be seen in each image. (B, D) T1-weighted contrast-enhanced images showing non-perfused lesions corresponding to the ablated necrotic zone of A and C post-PMWA; the yellow arrow identifies the endometrium.
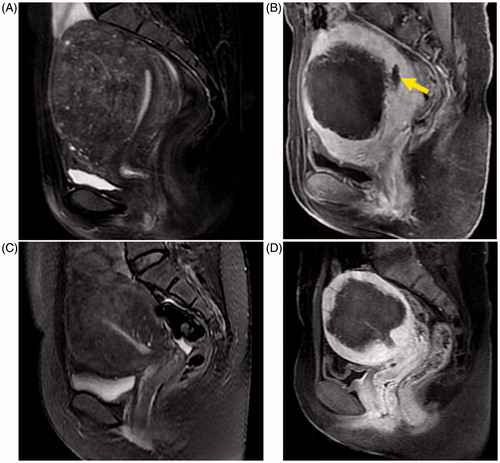
Table 1. Patient baseline characteristics; means ± SD or M (P25∼P75).
Table 2. Comparison of characteristics of lesion & microwave ablation relative parameters among groups; means ± SD or mean (P25∼P75).
Table 3. Logistic regression analysis of variables associated with presence of vaginal discharge post-ablation.
Table 4. Logistic regression analysis of variables associated with prolonged (≥ 20 days) vaginal discharge post-ablation.
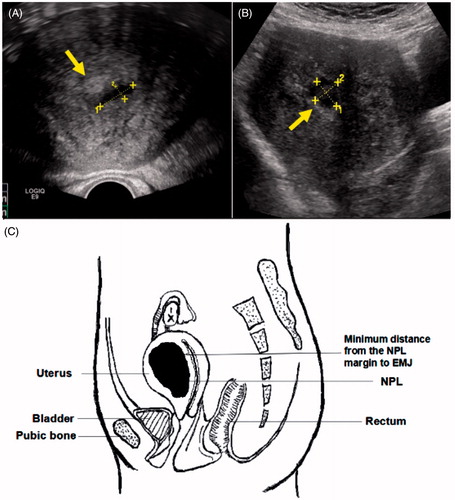
Figure 2. (A, B) The zone of liquidation necrosis as observed via ultrasonography; yellow arrows identify the endometrium. The liquidation necrotic zones were connected to the endometrium. (C) Schematic diagram post-ablation. EMJ, endomyometrial junction; NPV, non-perfused lesion volume; NPL, non-perfused lesion.