
Figures & data
Table 1. Baseline characteristics of patients.
Figure 1. A 45-year-old man with HCC in the right lobe of the liver treated with RF ablation combined with PEI. (A) Before ablation, contrast enhanced CT scans shows a 2.3-cm tumour located at the edge of hepatic segment V adjacent to the hepatic flexure of colon (arrowhead). (B) Before ablation, CEUS shows the tumour hyper-enhanced in the arterial phase. (C) Two RF ablation needles (short arrowhead) were placed into the tumour and one thermal monitoring needle (long arrowhead) was placed into the margin of the tumour proximal to the hepatic flexure of the colon for real-time temperature monitoring during the procedure. (D) The temperature monitoring curve during RF ablation for a tumour adjacent to the gastrointestinal tract. The temperature of the marginal tumor tissue adjacent to the gastrointestinal tract was monitored and controlled to fluctuate between 45 °C and 56 °C during the whole treatment procedure. (E) Contrast enhanced CT 3 months after treatment shows the tumour (arrowhead) is completely ablated. (F) CEUS 3 months after treatment shows the tumour is completely ablated. (G), Contrast enhanced CT scan 18 months after treatment shows the ablation zone (arrowhead) had no enhancement. (H) CEUS 18 months after treatment shows the ablation zone (arrowhead) had no enhancement.
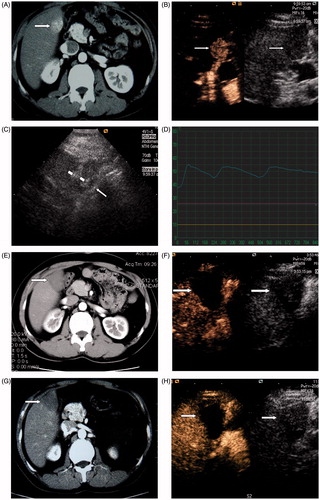
Table 2. Comparison of therapeutic data in the study an control group.