
Figures & data
Table 1. Patient population and tumour characteristics.
Figure 1. Microwave ablation (MWA) in a 56-year-old man with metastatic hepatocellular carcinoma in the right adrenal gland. (A) Contrast-enhanced ultrasound (CEUS) before MWA shows obvious enhancement in the arterial phase (arrow). (B) Antenna placement during the ablation of the right adrenal metastasis. (C) Computed tomography (CT) imaging obtained 6 days after MWA showed no enhancement (arrow). (D) Follow-up contrast magnetic resonance imaging (MRI) 1 year after MWA showed no enhancement of the target tumour.
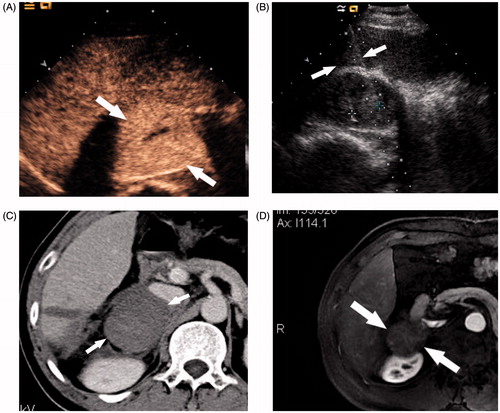
Figure 2. Cumulative incidence for local tumour progression (LTP) and death of ≤5 cm versus >5 cm tumour patients using Gray’s competing-risks regression analysis. There was a significant difference for LTP between the two groups (QGray = 7.19, p < 0.01), but not for death (QGray = 0.27, p = 0.61). Y-axis represents the cumulative incidence of LTP varied from 0 to 1, which is calculated using the formula (Number of LTP cases)/(Total population at risk). The larger the value of the y-axis, the higher the incidence of LTP. QGray represents the statistics of the Gray test. 1, LTP; 2, death.
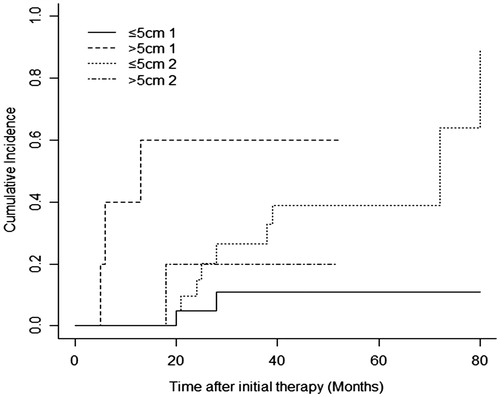
Figure 3. MWA in a 68-year-old female with an aldosterone-secreting adenoma on the right side of the adrenal gland. (A) Enhanced CT before the ablation treatment demonstrated obvious enhancement of a nodule (arrow) adjacent to both the right posterior lobe of the liver and the diaphragmatic crus. (B) Ultrasonograph during the ablation procedure showed the antenna placement (arrow) and the hyperechoic region covering the entire target lesion (arrow head). (C) CEUS 2 days after the procedure displayed no enhancement in the ablation zone (arrow) and no injury to the diaphragm. (D) Enhanced CT imaging 6 months after MWA showed a completely necrotising area (arrow).
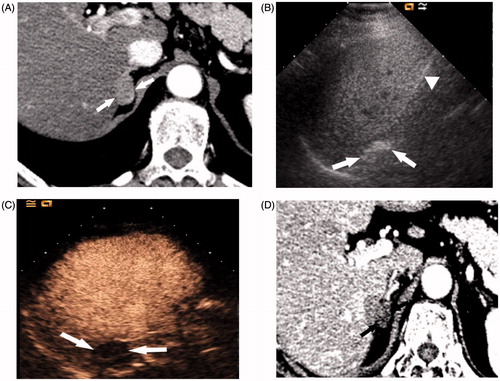
Table 2. Biochemical markers of aldosterone-secreting adenomas.
Table 3. Biochemical markers of pheochromocytomas.