Figures & data
Figure 1. Coercivity versus MNP size for an ensemble of magnetite nanoparticles.
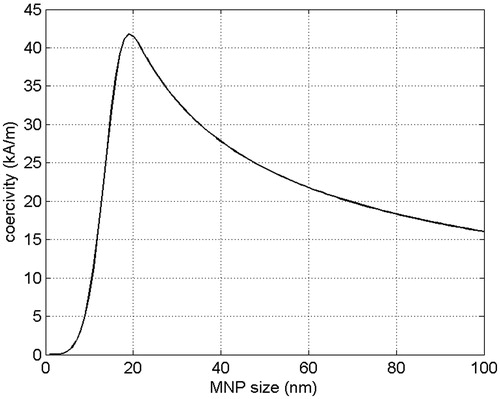
Table 1. Thermal and electric properties of some human tissues in the band 50–200 kHz.
Figure 2. A view of the model adopted in the simulation in CST software environment. (A) A cut of the numerical phantom, (B) exposure system and numerical phantom.
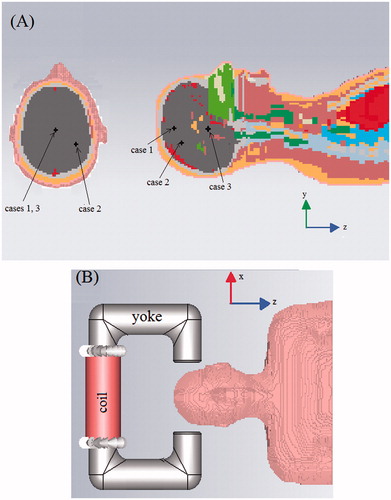
Table 2. Tumour and transition region positions and sizes considered in the numerical analysis.
Figure 3. Relative error in dB between the normalised (to Hf) electric power distributions dissipated in the numerical phantom at f1 = 50 kHz and f2 = 200 kHz. (A) Cut in the xy plane, (B) cut in the zx plane; (C) cut in the yz plane.
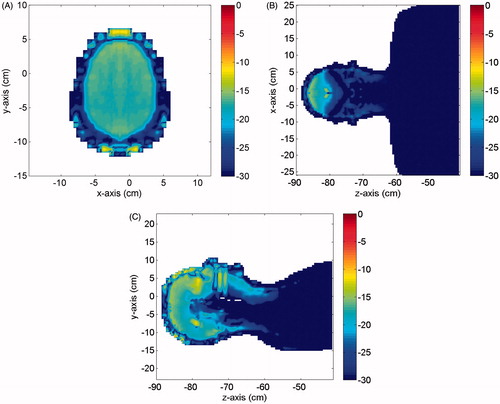
Table 3. Optimal values for ph, pe and Hf: MNPs uniformly distributed in the tumour.
Table 4. Optimal values for H, f, d and cmin: MNPs uniformly distributed in the tumour.
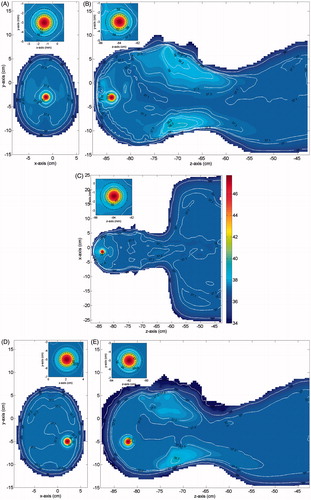
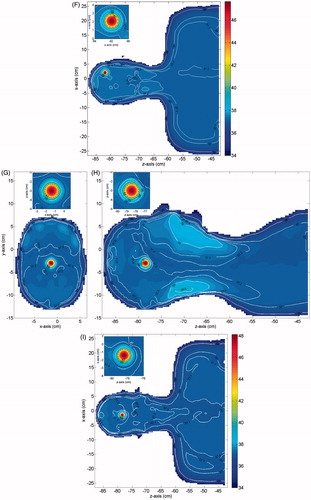
Figure 5. Normalised radial profile of the MNP distribution in the tumour.
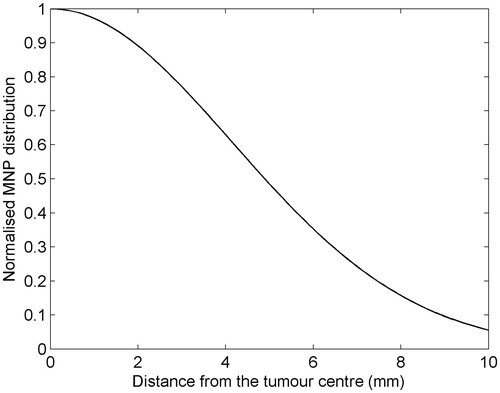
Table 5. Optimal vales for H, f, d and cmin: MNPs non-uniformly distributed in the tumour (Text = 25 °C).
Figure 6. Temperature distribution induced over the irradiated tissues (MNPs non-uniformly distributed in the tumour), for case 1 and Text = 25 °C: (A) cut in the xy plane, (B) cut in the yz plane, (C) cut in the zx plane. The insets show a zoom of the tumour (smallest black circle) and the transition region (largest black circle).
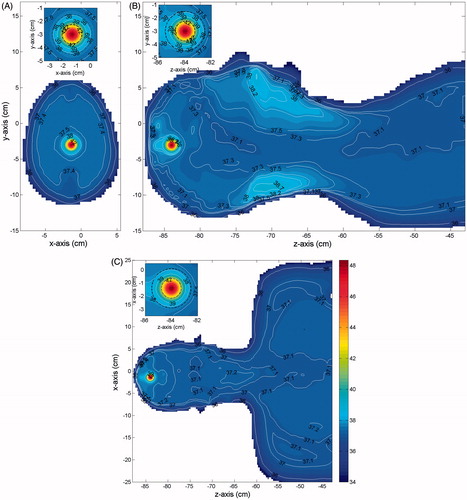
Table 6. Optimal values for H, f, d and cmin by using the experimental SAR in Malik et al. [Citation21] (Text = 25 °C).
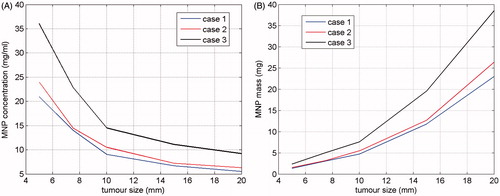
Figure 7. Required MNPs concentration (A) and MNPs total mass (B) for successfully heating tumors of different sizes, for each of the three positions in .