Figures & data
Figure 1. Temporal changes in vascular function following an increase in core body temperature in a patient with SCCHN (outlined in white). The panel of images represent parametric (a) blood volume (BV), (b) blood flow (BF) and (c) permeability surface (PS) maps calculated from perfusion CT scans at pre-heating (left), immediately post-heating (middle) and 5 days post-heating (right). Colour scale illustrates the increase in tumour BV, BF, and PS post-heat treatment.
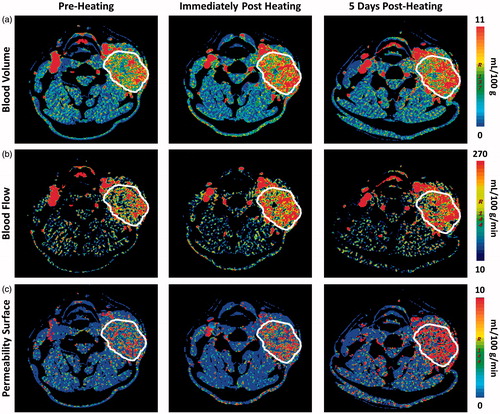
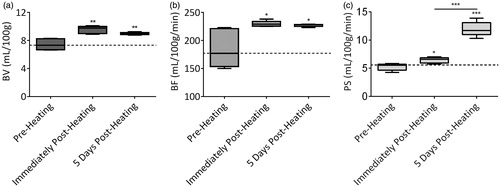
Figure 2. Perfusion parameters at pre- and post-heating calculated from perfusion CT in the patient with SCCHN. A region of interest was manually drawn along the margins of the tumour for calculation of (a) blood volume (mL/100 g), (b) blood flow (mL/100 g/min) and (c) permeability surface (mL/100 g/min). *p < 0.05, **p < 0.01, ***p < 0.0001 (Mann–Whitney test).