Figures & data
Table 1. Demographic data of the CI and NH participants.
Table 2. Mean (and standard deviation) from items involving parental ratings of both their CI and NH child’s perceptual ability.
Figure 1. Mean and standard deviation for items 8 to 11 showing parental ratings of vocal effort and enunciation in their own speech (left panel) and the frequency with which their CI child responds to their name being called (right panel).
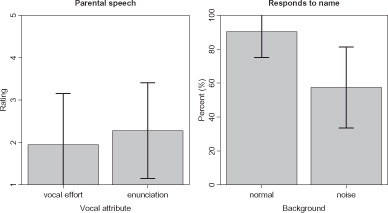
Table 3. Factor scores for the loadings of the rotated component matrix.
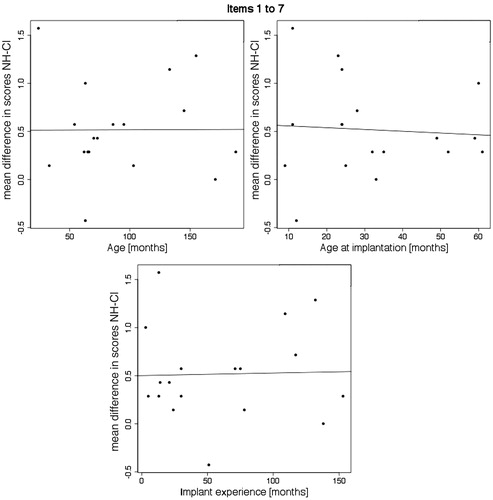
Figure 2. Scatterplots and regression line of the difference between NH and CI responses according to age (left panel), age at implantation (right panel) and duration of implant experience (lower panel).