Figures & data
Table 1. Normal serum used for immunocytochemistry.
Table 2. Primary antibodies used for immunocytochemistry.
Table 3. Secondary antibodies used for immunocytochemistry.
Table 4. Primary antibodies used for Western blot.
Table 5. Secondary antibodies used for Western blot.
Figure 1. Characterization of cells extracted from healthy human cornea. Immunocytochemistry of the cells extracted from healthy human cornea after 24 h of culture in DMEM medium supplemented with either 0.1% or 2% fetal bovine serum (FBS) for 24 h shows that several cells were weakly stained for CD34 in 0.1% FBS condition (A) whereas the majority of cells showed a weak but positive staining in 2% FBS (B). ALDH (C and D) and lumican (G and H) stainings showed almost no positive reactions in both culture conditions. Keratocan was highly expressed in both 0.1% FBS (E) and 2% FBS (F) culture conditions. Western blot experiments were also performed on the cells and showed that all the markers were expressed by the cells in both culture conditions. Densitometry analysis further revealed no statistically significant (ns) difference in expression of CD34 between the cells cultured in 0.1% and 2% FBS (I). ALDH (J) and keratocan (K) had a significantly higher expression in cells cultured in 2% FBS than in 0.1% FBS (**p < 0.01 and ***p < 0.001, respectively). On the contrary, cells expressed significantly more lumican (L) in the 0.1% FBS than in 2% FBS culture conditions (***p < 0.001). In addition, cells strongly expressed pro collagen I in both culture conditions, with a significantly higher expression in medium supplemented with 2% FBS (*p < 0.05) (M). Values are means ± SD.
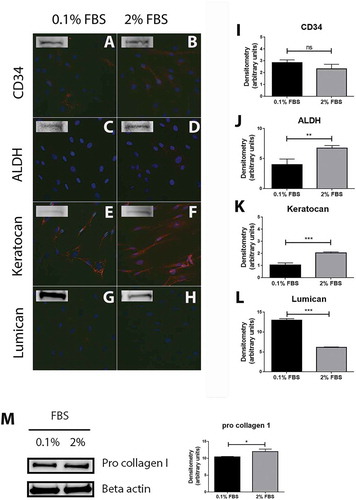
Figure 2. TGF-β stimulation of human keratocytes in vitro. Immunocytochemistry of human keratocytes in vitro revealed the presence of TGF-β receptor I (TGFBR1; red) in all cells cultured in medium supplemented with 0.1% FBS (A) and 2% FBS (B). TGF-β receptor II (TGFBR2; red) was also strongly positive in all cells in the 0.1% (C) and 2% (D) FBS culture conditions. TGF-β receptor III (TGFBR3) showed a more intense staining in the 2% FBS culture (F) than in the 0.1% FBS condition (E). All slides were double stained with DAPI (blue) to identify cell nuclei. ((G) and (H)) Cells were treated with TGF-β1 (10 ng/ml), the TGF receptor I inhibitor GW788388 (10 ng/ml) or both, 24, 48, or 72 h prior to RNA extraction and conversion to cDNA. qPCR showed an increase of αSMA mRNA levels (G) in TGF-β1 treated cells compared to untreated cells 24 h after stimulation. GW 788388 significantly reduced the effect of TGF-β1. For the NK-1 receptor, mRNA levels decreased significantly in TGF-β1 treated cells as compared to untreated (***p < 0.001 at 24 and 48 h, **p < 0.01 at 72 h). GW 788388 slightly reduced the effect of TGF-β1 at 24 h but not significantly (ns). Values are means ± SD.
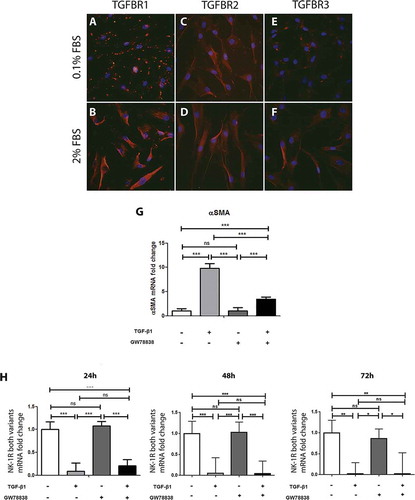
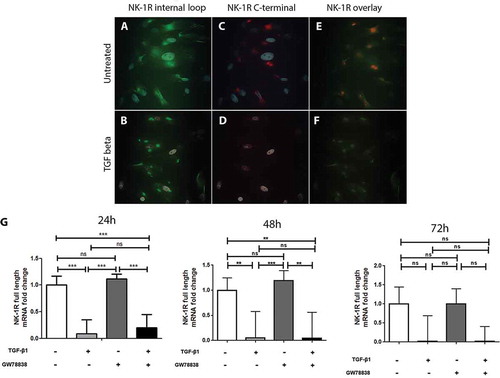
Figure 3. TGF-β1 down-regulates the expression of the full-length but not of the truncated form of NK-1 R in human keratocytes in vitro. Immunocytochemistry of the untreated ((A), (C), and, (E)) or TGF-β1 treated ((B), (D), and (F)) human keratocytes in vitro shows that untreated cells display positive reactions for the antibody targeting the inner-loop of NK-1 R (green) (A) as well as for the antibody targeting the C-terminal of the receptor (red) (C). Both antibodies overlap (yellow) but some green staining is still visible, indicating that both forms are expressed (E). The reactions of the inner-loop antibody are still present in the TGF-β1 treated cells (B), but the full-length receptor is not expressed anymore (D), as is confirmed by the overlapping image in which no yellow color can be seen (F). DAPI (blue) was applied to identify nuclei. (G) Quantitative real-time PCR, using a probe that specifically targets the full-length form of the NK-1 receptor further confirms the down-regulation of this isoform of the receptor after TGF-β1 treatment (***p < 0.001 at 24 h, **p < 0.01 at 48 h, not significantly (ns) at 72 h). The TGF receptor I inhibitor GW 788388 reduces the effect of TGF-β1 at 24 h, but this was not significant (ns). Values are means ± SD.