Figures & data
Figure 1. Process of the development of proposals for quality indicators. n = number of proposals for quality indicators.
Figure 2. Example of feedback on the experts’ rating between the two Delphi rounds. The experts rating is marked as “your score”.
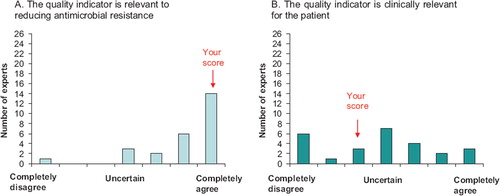
Table I. Quality indicators focusing on the diagnostic process.
Table II. Quality indicators focusing on the decision concerning treatment with antibiotics.
Table III. Quality indicators focusing on choice of antibiotics (relevance for antimicrobial resistance).