Figures & data
Figure 1. Distributions of age and BMI measured during the first visit are shown with box plots according to the smoking status at the two-year control visit. Smokers with higher BMI (p < 0.001, analysis of variance) and older age (p < 0.001, analysis of variance) were more likely to have stopped smoking.
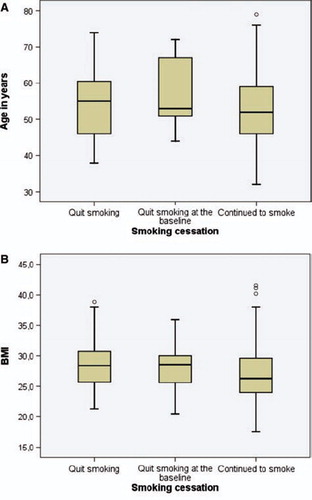
Table I. Distribution of smoking cessation status by gender, symptoms, attitude to intervention, and use of pharmacological aids to quitting.
Table II. Smoking cessation according to COPD GOLD stages and the national Finnish criteria of obstruction and classification of airway limitation by national MEF50 criteria.