Figures & data
Figure 1. Demographic characteristics of 456 cases of Hantavirus infection in northern Sweden October 2006–December 2008.
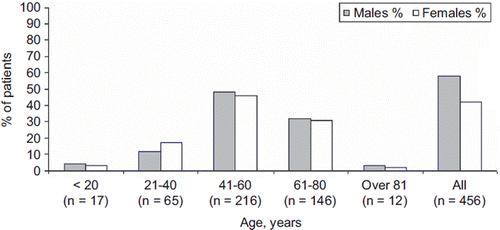
Figure 2. Overview of Hantavirus patients in relation to level of care in 456 cases of Hantavirus infection in northern Sweden October 2006–December 2008.
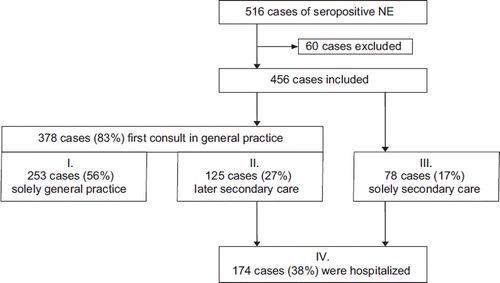
Figure 3. Frequency of various symptoms among 456 Hantavirus patients in northern Sweden October 2006–December 2008.
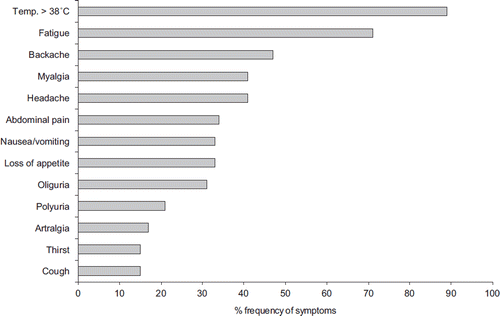
Table I. Laboratory findings among 456 Hantavirus patients in northern Sweden October 2006–December 2008.
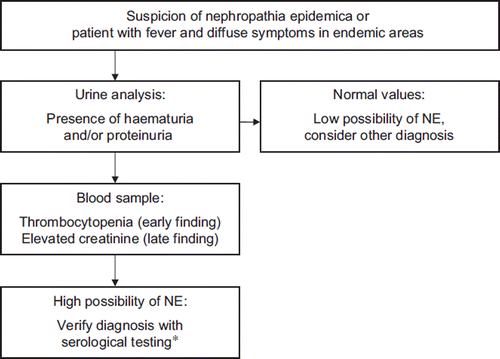
Figure 4. Proposed decision aid for early diagnosis of nephropathia epidemica (NE). *Point-of-care test or serological testing at clinical microbiological laboratory.