Figures & data
Table I. Prevalence of patient characteristics, symptoms, and findings in 803 primary care patients with acute cough categorized by CRP testing and network.
Table II. Frequency of antibiotics prescribed by patient characteristics, symptoms, and findings in 803 primary care patients with acute cough categorized by PoC CRP testing and network.
Figure 1. Frequency of prescribing antibiotics by CRP value in 372 Scandinavian patients with acute cough.
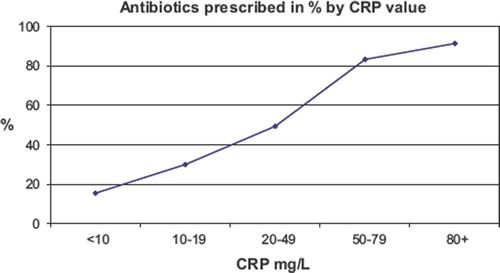
Table III. Predictive value (odds ratio) for prescribing antibiotics of patients’ characteristics, symptoms, and findings determined by multivariate logistic regression in 803 primary care patients with acute cough categorized by PoC CRP testing and network.
Figure 2. The ROC curve shows the predictive value of “the clinical model only” for antibiotic prescribing in the Welsh subgroup (n = 300) and the Scandinavian subgroup not tested for CRP (n = 131). Discoloured sputum, the four abnormal lung sounds and perceived patient preference for antibiotics are the variables included in the model.
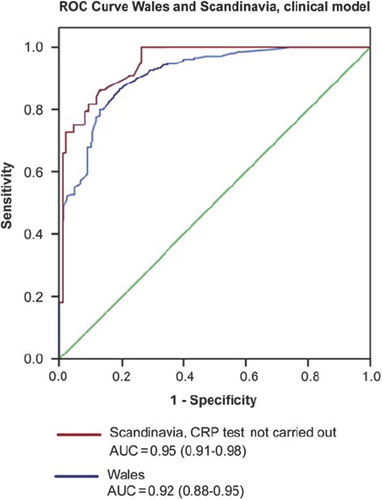
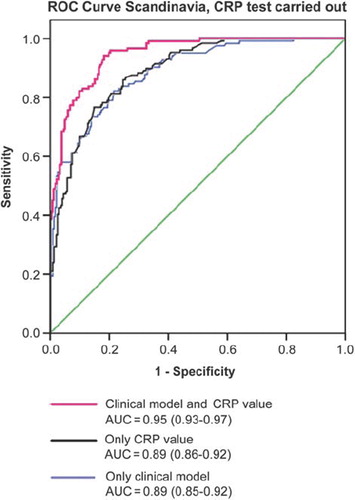
Figure 3. The ROC curve shows the predictive value of the clinical model and CRP, separately and together, for antibiotic prescribing. Results for the Scandinavian subgroup tested for CRP (n = 131).