Figures & data
Table I. Baseline characteristics of the cohort studied.
Table II. Discrimination, calibration, and validity statistics for predicted 10-year risk of cardiovascular disease by SCORE and original Framingham risk functions.
Figure 1. Risk category distribution of the population according to the original Framingham and SCORE risk functions.
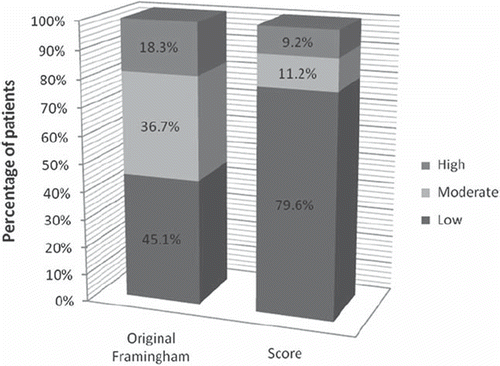
Table III. Characteristics of patients identified as of high risk by any of the two functions.
Table IV. Patients in the total population identified as candidates for drug therapy (lipid-lowering or antihypertensive) according to the recommendations of the SCORE guidelines, with the risk estimated by the original Framingham and SCORE functions.