2,536
Views
25
CrossRef citations to date
0
Altmetric
Original Article

Drug treatment in the elderly: An intervention in primary care to enhance prescription quality and quality of life

, &
Pages 3-9 | Received 14 Mar 2011, Accepted 24 Aug 2011, Published online: 18 Dec 2011

Figures & data

Figure 1. Study flow chart.

Note: Flow chart of the study and randomization process. Dropouts for other reasons include no answer after three telephone calls, not opening the door at agreed visiting time, and no longer willing to participate.

Figure 1. Study flow chart.Note: Flow chart of the study and randomization process. Dropouts for other reasons include no answer after three telephone calls, not opening the door at agreed visiting time, and no longer willing to participate.

Table I. Prescription quality.

Table II. Frequency distribution (profile) of the EQ-5D descriptive system for comparison.1

Figure 2. EQ-5D index. Note: Statistical analyses were done within and between the groups using the Friedman test and Kruskal–Wallis test. No significant difference anywhere.

Figure 2. EQ-5D index. Note: Statistical analyses were done within and between the groups using the Friedman test and Kruskal–Wallis test. No significant difference anywhere.

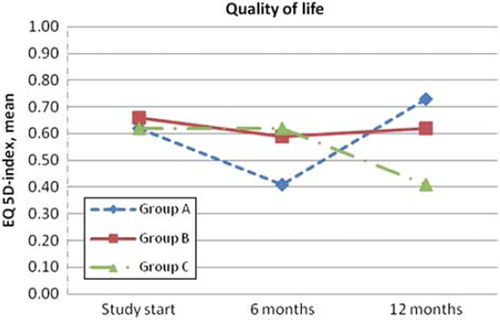
Table III. Patients’ assessments of their own health-related quality of life, EQ VAS.