
Figures & data
Figure 1. Flow-chart of how patients were recruited. MMI refers to multimodal intervention, CBT to cognitive behavioural therapy. Entries with bold text indicate data for the present study.
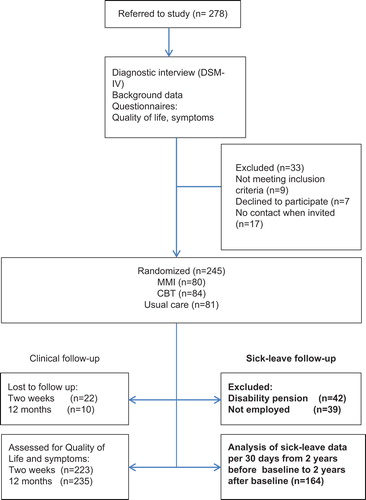
Table I. Baseline data for the three study groups.1
Figure 2. Mean number of sick-leave days at different points in time, relative to randomization for the three groups. CAU refers to “care as usual”.
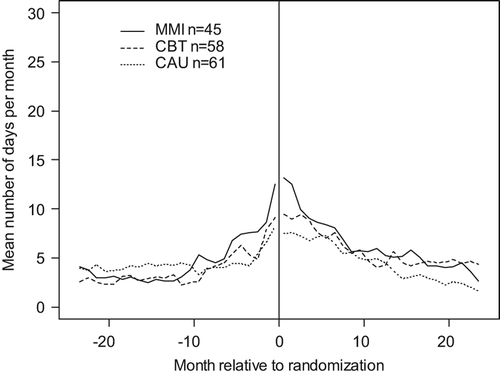
Table II. Odds ratios (95% CI) for being sick-listed as comparisons between groups at different times, relative to randomization.1