
Figures & data
Figure 1. Sources and codes for identification of patients with five chronic diseases.
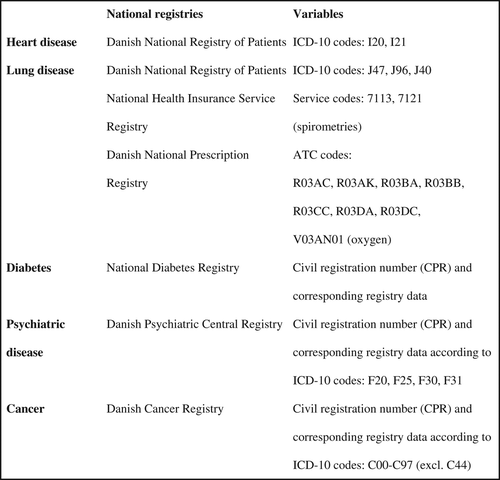
Figure 2. Remuneration codes for services provided by general practice (used in this study).
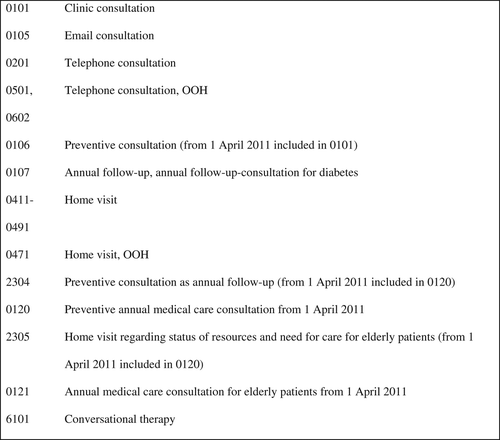
Table I. Proportions of patients who either had a new contact with the OOH, a contact with the daytime GP, a hospital admission, or died during a 30-day follow-up after OOH contact: Distribution shows the five chronic diseases, the 2 + diagnosed, and other patients.1,2
Table II. Risk for patients with an OOH index contact due to an exacerbation for new contact with OOH, contact with daytime GP, hospital admission, or death during 30-day follow-up, distributed over the five chronic diseases, for other patients, and for the total population (shown as incidence risk rate [IRR]).
Table III. Odds ratios (OR) for OOH users within each of the five disease groups for getting in contact with the healthcare system or dying during the 30-day follow-up (patients without chronic disease served as reference group).1,2
Table IV. Distribution of patients who died during the 30-day follow-up period after OOH contact with respect to age, exacerbation, or new health problem, and gender.1