Figures & data
Table 1. Descriptive data for all patients in the NDR for the study and reference county in 2010 and 2011 (aged 18–79).
Table 2. Descriptive and outcome data for patients in the study county in 2011 with DM duration of at least two years broken down into two groups: (1) patients already in the register (existing patients) – entered in 2011 and 2009/2010); (2) new patients in the register – entered in 2011 but not 2009–2010: Crude data and adjusted for diabetes duration, age, and sex.
Table 3. Percentage of patients with entry of separate variable for the study and reference county in 2010 and 2011.
Table 4. Percentage (%) of patients in various BP categories for the study and reference county in 2010 and 2011.
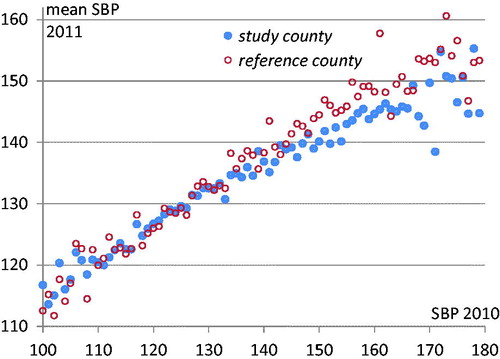
Figure 1. Mean systolic blood pressure in 2011 (Y-axis) for each 1 mm blood pressure reading in 2010 (X-axis) for the study and reference county (98.9% of patients had SBP of 100–180 in 2010).