Figures & data
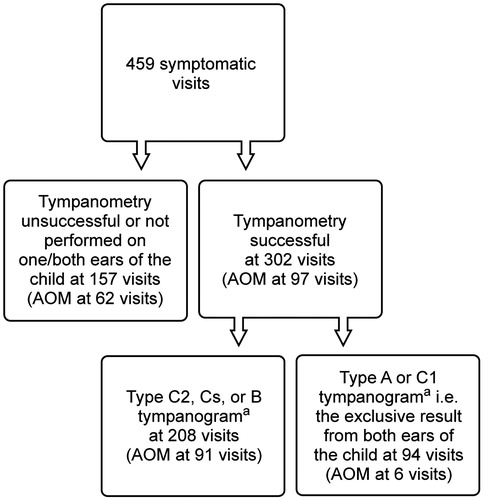
Figure 1. Flow chart of the included children, visits, and tympanometric and spectral gradient acoustic reflectometry (SG-AR) examinations.
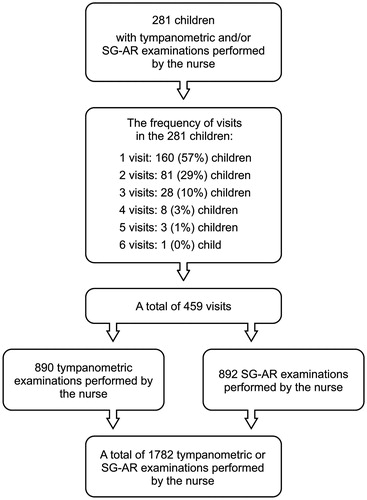
Table 1. Successful tympanometric examinations (n = 670) performed by the nurses.
Table 2. Predictive values (with respective 95% confidence intervals [CI]) for the diagnostic test results with tympanometry (n = 670) and spectral gradient acoustic reflectometry (SG-AR) (n = 782) obtained by the nursesTable Footnote1.
Table 3. Successful spectral gradient acoustic reflectometry (SG-AR) examinations (n = 782) performed by the nurses.
Figure 2. Exclusion of acute otitis media (AOM) based on tympanometry performed by the nurses at symptomatic visits (n = 459). Type A and C1 tympanograms from both ears of the child were regarded as the exclusive test result for AOM.
Notes: aClassification of tympanograms. Type A (tympanometric peak pressure greater than –100 daPa); type C1 (the pressure between –100 and –199 daPa); type C2 (pressure –200 daPa or less); type Cs (width >300 daPa or static acoustic admittance <0.2 mmho); and type B (flat).