Figures & data
Figure 1. Tumor histology and MRI specimens – exemplified by Good-Responder #1 and Poor-Responder #2. (a) Diagnostic tumor biopsies, each in two magnifications, from rectum displaying SRCC differentiation. (b) Diagnostic MRI scans, axial and T2-weighted images, illustrating rectal tumors with SRCC signal pattern. (c) Preoperative MRI scans, axial and T2-weighted images, illustrating rectal tumors with SRCC signal pattern. (d) Surgical specimens, in several magnifications, depicting treatment responses.
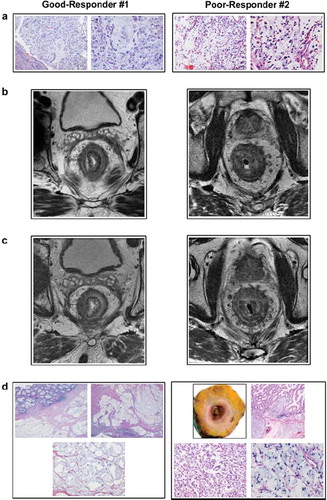
Table I. Clinical patient characteristics
Table II. Findings on diagnostic MRI examinations
Table III. Histopathology findings in surgical specimens