Figures & data
Figure 1. Simulated oxygen distribution in a theoretical tumour used in this study. It was assumed that the simulated tumour has two hypoxic islands surrounded by cells that are better oxygenated. The local oxygen distributions for each region are indicated in the insets.
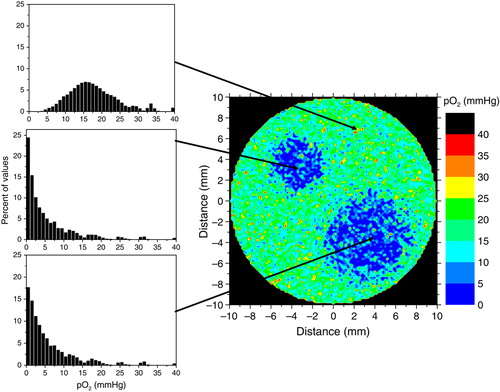
Figure 2. Different patterns of oxygenation simulated in the study. (a) The reoxygenation affects the distribution at the microscopic level only, while the overall regional oxygenations remain the same. (b) The hypoxic islands in the tumour shrink during the course of the treatment. (c) The regional oxygenations might change location due to complex patterns of vascular failure that may occur during the treatment.
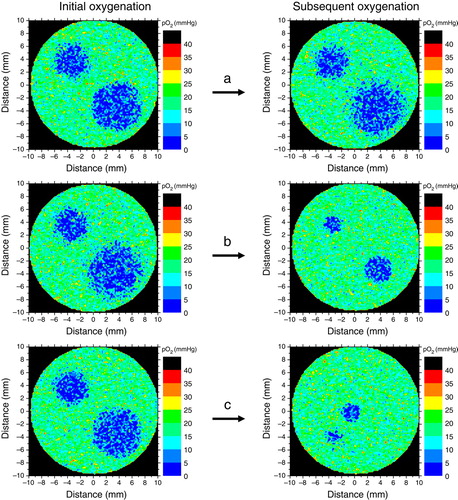
Figure 3. Dose distributions calculated to give a predefined tumour control level of 90%; (a) – heterogeneous distribution, , calculated with Equation6 from the derived radioresistance map of the tumour; (b) – segmented dose distribution, DP, calculated with Equation9.
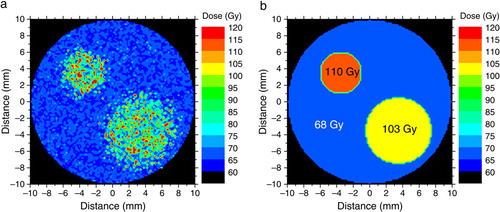
Figure 4. Variations in the achievable tumour control probability due to modifications of the hypoxic pattern in the tumour. Solid symbols show the response to uniform doses delivered to the target. Open symbols show the response to a segmented dose distribution derived with Equation9.
Table I. Predicted tumour control probabilities for various numbers of reoxygenations