Figures & data
Figure 1. CT scans of the first patient at baseline (A) and after (B) one cycle of sunitinib. A1 and B1: The primary tumour has decreased in size. A 2–3 and B 2–3: The caval vein thrombosis has increased in size (A2 and B2) and extends from infrahepatic (A2) towards the right atrium (B3). Note the absence of the thrombus in the right atrium before treatment (A3).
Figure 2. CT scan of the primary tumour of the second patient at baseline (A) and after two cycles of sunitinib demonstrating a newly formed thrombus in the caval vein (arrows) (B).
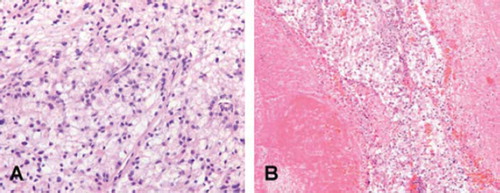
Figure 3. Histology of the primary tumour (A) (H&E, 200×) and the caval vein thrombus which contains vital tumour cells of clear cell histology (B) (H&E, 100×).