Figures & data
Figure 1. Trends in age-standardised (World) incidence and mortality rates per 100 000 and age-standardised (ICSS) 5-year relative survival for patients of kidney cancer by sex and country. Nordic cancer survival study 1964–2003.
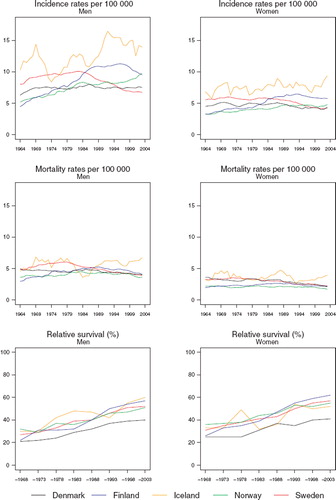
Table I. Trends in survival for kidney cancer by sex and country. Number of tumours (N) included and the 5-year age-standardised (ICSS) relative survival in percent with 95% confidence intervals (RS (CI)). Nordic cancer survival study 1964–2003.
Table II. Trends in 5-year age-specific relative survival in percent after kidney cancer by sex and country. Nordic cancer survival study 1964–2003.
Figure 2. Trends in age-standardised (ICSS) excess death rates per 100 person years for kidney cancer by sex, country, and time since diagnosis in Nordic cancer survival study 1964–2003.
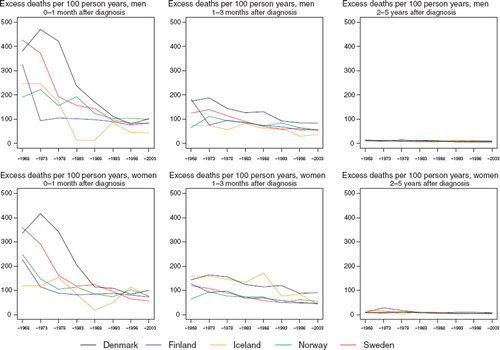
Figure 3. Trends in age-standardised (World) incidence and mortality rates per 100 000 and age-standardised (ICSS) 5-year relative survival for patients of bladder cancer by sex and country. Nordic cancer survival study 1964–2003.
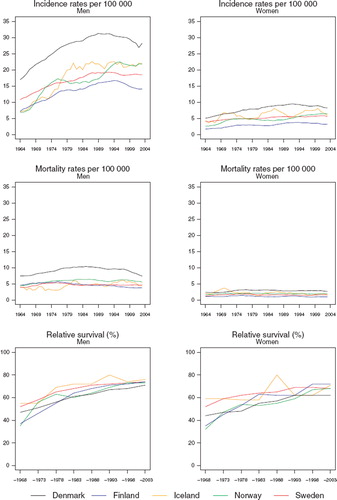
Table III. Trends in survival for bladder cancer by sex and country. Number of tumours (N) included and the 5-year age-standardised (ICSS) relative survival in percent with 95% confidence intervals (RS (CI)). Nordic cancer survival study 1964–2003.
Figure 4. Trends in age-standardised (ICSS) excess death rates per 100 person years for bladder cancer by sex, country, and time since diagnosis in Nordic cancer survival study 1964–2003.
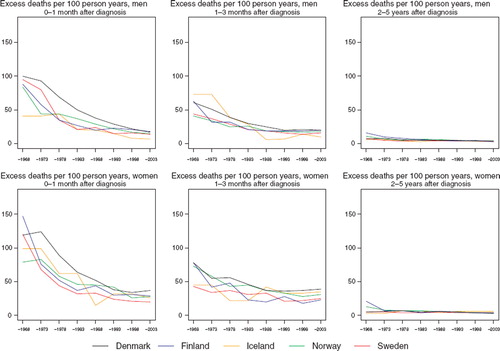
Table IV. Trends in 5-year age-specific relative survival in percent after bladder cancer by sex and country. Nordic cancer survival study 1964–2003.