Figures & data
Figure 1. Trends in age-standardised (World) incidence and mortality rates per 100 000 and age-standardised (ICSS) 5-year relative survival for Hodgkin lymphoma by sex and country. Nordic cancer survival study 1964–2003.
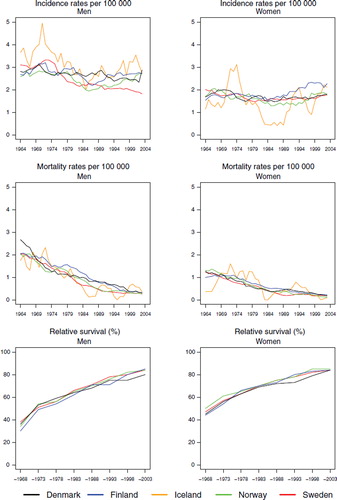
Table I. Trends in survival for Hodgkin lymphoma by sex and country. Number of tumours (N) included and the 5-year age-standardised (ICSS) relative survival in percent with 95% confidence intervals (RS (CI)). Nordic cancer survival study 1964–2003.
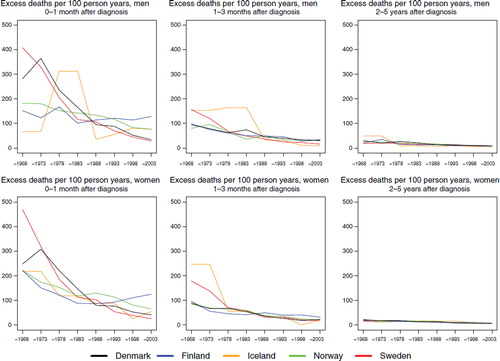
Figure 2. Trends in age-standardised (ICSS) excess death rates per 100 person years for Hodgkin lymphoma by sex, country, and time since diagnosis in Nordic cancer survival study 1964–2003. No Icelandic curves. Too few patients to calculate rates for Iceland.
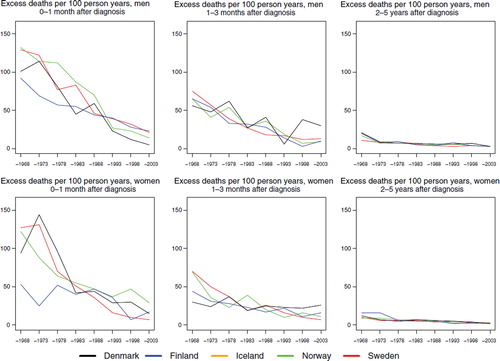
Table II. Trends in 5-year age-specific relative survival in percent after Hodgkin lymphoma by sex and country. Nordic cancer survival study 1964–2003.
Figure 3. Trends in age-standardised (World) incidence and mortality rates per 100 000 and age-standardised (ICSS) 5-year relative survival for non-Hodgkin lymphoma by sex and country. Nordic cancer survival study 1964–2003.
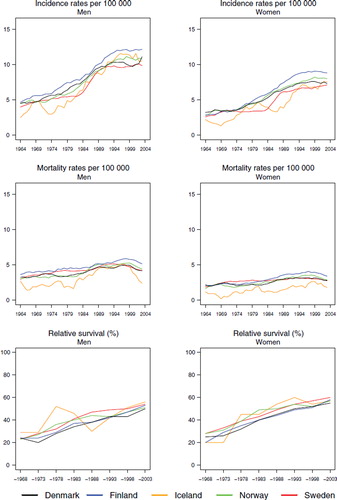
Table III. Trends in survival for non-Hodgkin lymphoma by sex and country. Number of tumours (N) included and the 5-year age-standardised (ICSS) relative survival in percent with 95% confidence intervals (RS (CI)). Nordic cancer survival study 1964–2003.
Table IV. Trends in 5-year age-specific relative survival in percent after non-Hodgkin lymphoma by sex and country. Nordic cancer survival study 1964–2003.
Figure 4. Trends in age-standardised (ICSS) excess death rates per 100 person years for non-Hodgkin lymphoma by sex, country, and time since diagnosis in Nordic cancer survival study 1964–2003.
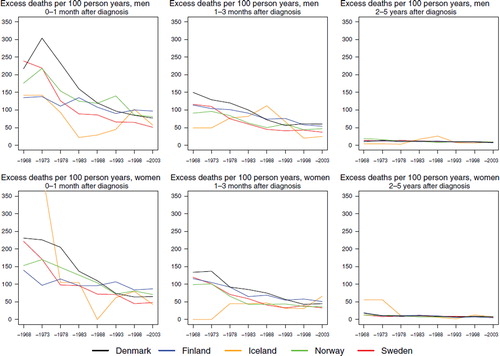
Figure 5. Trends in age-standardised (World) incidence and mortality rates per 100 000 and age-standardised (ICSS) 5-year relative survival for multiple myeloma by sex and country. Nordic cancer survival study 1964–2003.
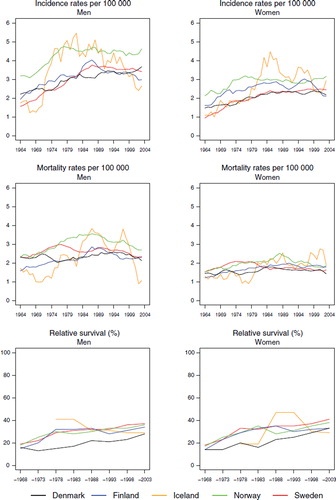
Figure 6. Trends in age-standardised (ICSS) excess death rates per 100 person years for multiple myeloma by sex, country, and time since diagnosis in Nordic cancer survival study 1964–2003.
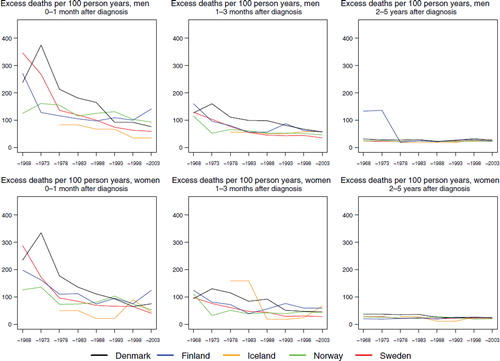
Table V. Trends in survival for multiple myeloma by sex and country. Number of tumours (N) included and the 5-year age-standardised (ICSS) relative survival in percent with 95% confidence intervals (RS (CI)). Nordic cancer survival study 1964–2003.
Table VI. Trends in 5-year age-specific relative survival in percent after multiple myeloma by sex and country. Nordic cancer survival study 1964–2003.
Figure 7. Trends in age-standardised (World) incidence and mortality rates per 100 000 and age-standardised (ICSS) 5-year relative survival for acute leukaemia by sex and country. Nordic cancer survival study 1964–2003.
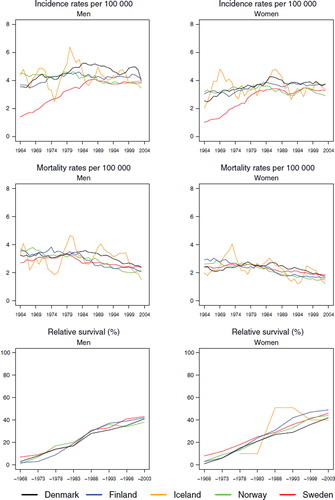
Figure 8. Trends in age-standardised (World) incidence and mortality rates per 100 000 and age-standardised (ICSS) 5-year relative survival for other leukaemia by sex and country. Nordic cancer survival study 1964–2003.
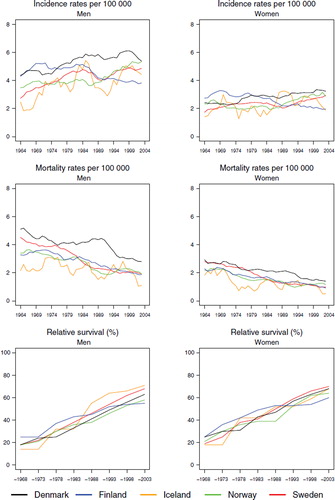
Table VII. Trends in survival for acute leukaemia by sex and country. Number of tumours (N) included and the 5-year age-standardised (ICSS) relative survival in percent with 95% confidence intervals (RS (CI)). Nordic cancer survival study 1964–2003.
Table VIII. Trends in survival for other leukaemia by sex and country. Number of tumours (N) included and the 5–year age–standardised (ICSS) relative survival in percent with 95% confidence intervals (RS (CI)). Nordic cancer survival study 1964–2003.
Table IX. Trends in 5–year age–specific relative survival in percent after acute leukaemia by sex and country. Nordic cancer survival study 1964–2003.
Table X. Trends in 5–year age–specific relative survival in percent after other leukaemia by sex and country. Nordic cancer survival study 1964–2003.
Figure 9. Trends in age-standardised (ICSS) excess death rates per 100 person years for acute leukaemia by sex, country, and time since diagnosis in Nordic cancer survival study 1964–2003.
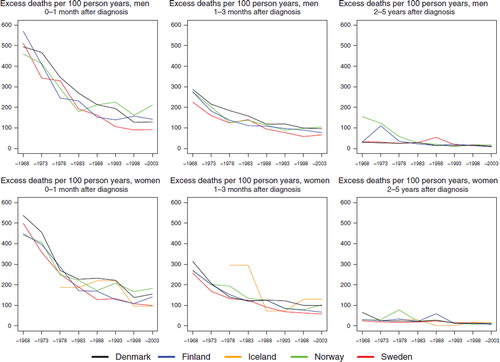
Figure 10. Trends in age-standardised (ICSS) excess death rates per 100 person years for other leukaemia by sex, country, and time since diagnosis in Nordic cancer survival study 1964–2003.