Figures & data
Figure 1. Trends in age-standardised (World) incidence and mortality rates per 100 000 and age-standardised (ICSS) 5-year relative survival for cancer of cervix uteri by country. Nordic cancer survival study 1964–2003.
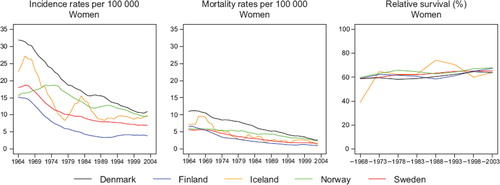
Table I. Trends in survival for cancer of cervix uteri by country. Number of tumours (N) included and the 5-year age-standardised (ICSS) relative survival in percent with 95% confidence intervals (RS (CI)). Nordic cancer survival study 1964–2003.
Table II. Trends in 5-year age-specific relative survival in percent after cancer of cervix uteri by country. Nordic cancer survival study 1964–2003.
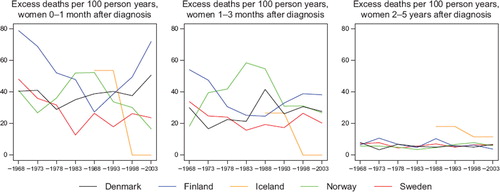
Figure 2. Trends in age-standardised (ICSS) excess death rates per 100 person years for cancer of cervix uteri by country and time since diagnosis. Nordic cancer survival study 1964–2003.
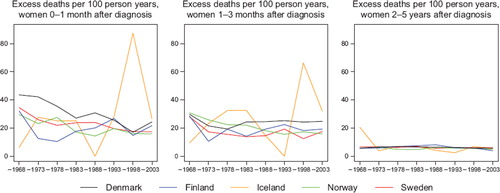
Figure 3. Trends in age-standardised (World) incidence and mortality rates per 100 000 and age-standardised (ICSS) 5-year relative survival for cancer of corpus uteri by country. Nordic cancer survival study 1964–2003.
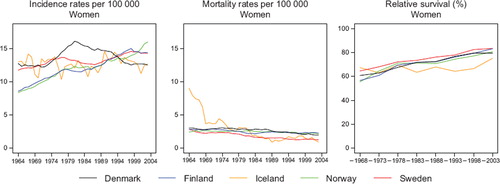
Table III. Trends in survival for cancer of corpus uteri by country. Number of tumours (N) included and the 5-year age-standardised (ICSS) relative survival in percent with 95% confidence intervals (RS (CI)). Nordic cancer survival study 1964–2003.
Figure 4. Trends in age-standardised (ICSS) excess death rates per 100 person years for cancer of corpus uteri by country and time since diagnosis. Nordic cancer survival study 1964–2003.
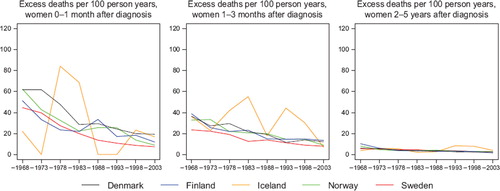
Table IV. Trends in 5-year age-specific relative survival in percent after cancer of corpus uteri by country. Nordic cancer survival study 1964–2003.
Figure 5. Trends in age-standardised (World) incidence and mortality rates per 100 000 and age-standardised (ICSS) 5-year relative survival for ovarian cancer by country. Nordic cancer survival study 1964–2003.
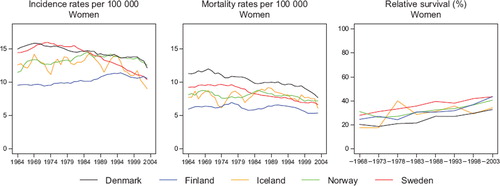
Table V. Trends in survival for ovarian cancer by country. Number of tumours (N) included and the 5-year age-standardised (ICSS) relative survival in percent with 95% confidence intervals (RS (CI)). Nordic cancer survival study 1964–2003.
Figure 6. Trends in age-standardised (ICSS) excess death rates per 100 person years for ovarian cancer by country and time since diagnosis. Nordic cancer survival study 1964–2003.
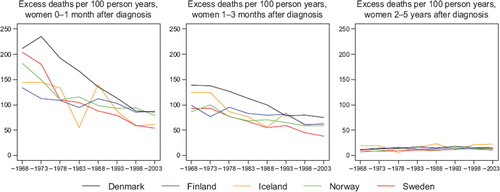
Table VI. Trends in 5-year age-specific relative survival in percent after ovarian cancer by country. Nordic cancer survival study 1964–2003.
Figure 7. Trends in age-standardised (World) incidence and mortality rates per 100 000 and age-standardised (ICSS) 5-year relative survival for cancer of other female genital organs by country. Nordic cancer survival study 1964–2003.
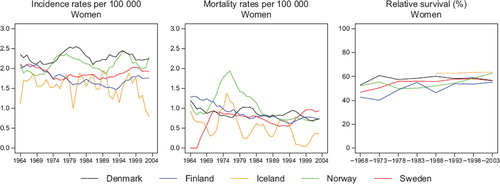
Table VII. Trends in survival for cancer in other female genital organs by country. Number of tumours (N) included and the 5-year age-standardised (ICSS) relative survival in percent with 95% confidence intervals (RS (CI)). Nordic cancer survival study 1964–2003.
Table VIII. Trends in 5-year age-specific relative survival in percent after cancer in other female genital organs by country. Nordic cancer survival study 1964–2003.
Figure 8. Trends in age-standardised (ICSS) excess death rates per 100 person years for cancer of other female genital organs by country and time since diagnosis. Nordic cancer survival study 1964–2003.