Figures & data
Table I. Cancer cases included in the Nordic cancer survival study 1964-2003 by site and country. Men
Table II. Cancer cases included in the Nordic cancer survival study 1964-2003 by site and country. Women
Table III. Proportion of microscopically-verified tumors, tumors registered by DCO (Death Certificate Only) and by incidental autopsy for cancer of all sites but non-melanoma skin in the Nordic cancer survival study 1964-2003, by country and year of diagnosis.
Figure 1. Age-specific population mortality rates for ages 40 and above in the Nordic countries in 2003 by sex and country. Death rates are smoothed using a 5-year moving average over the years 2001–2005 [Citation27].
![Figure 1. Age-specific population mortality rates for ages 40 and above in the Nordic countries in 2003 by sex and country. Death rates are smoothed using a 5-year moving average over the years 2001–2005 [Citation27].](/cms/asset/1db5a4b4-88b6-4096-8669-8e8a33070e7c/ionc_a_474454_f0001_b.jpg)
Figure 2. Trends in life expectancy at birth in the Nordic countries by sex and country [Citation27].
![Figure 2. Trends in life expectancy at birth in the Nordic countries by sex and country [Citation27].](/cms/asset/d2df492a-3b20-4fa6-af5a-560fddffb575/ionc_a_474454_f0002_b.jpg)
Table IV. International Cancer Survival Standards (ICSS). Three standard weight functions for age-standardisation of relative survival as used in Nordic cancer survival study 1964-2003.
Figure 3. Trends in age-specific excess deaths per 100 person years in the first three months after diagnosis for cancer patients of all cancer sites but non-melanoma skin patients diagnosed 1999–2003 by sex and country. Nordic cancer survival study 1964–2003.
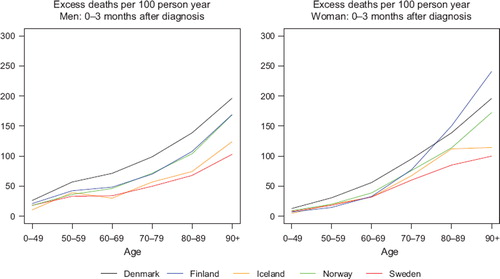
Figure 4. Trends in age-specific excess deaths per 100 person years in the first three months after diagnosis for colon cancer patients diagnosed 1999–2003 by sex and country. Nordic cancer survival study 1964–2003.
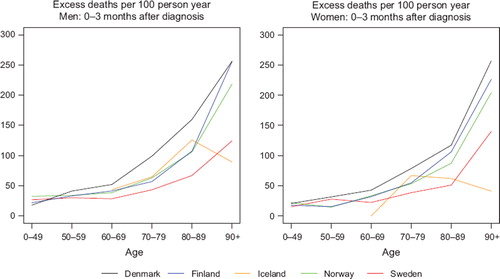
Figure 5. Effect on 5-year relative survival of excluding patients 90 years or older at diagnosis over calendar time among Danish female breast cancer patients and Swedish prostate cancer patients. Nordic cancer survival study 1964–2003.
Figure 6. Trends in age-standardised (World) incidence and mortality rates per 100 000 and age-standardised (ICSS) 5-year relative survival for patients of all cancer sites but non-melanoma skin, unadjusted for case-mix by sex and country. Nordic cancer survival study 1964–2003.
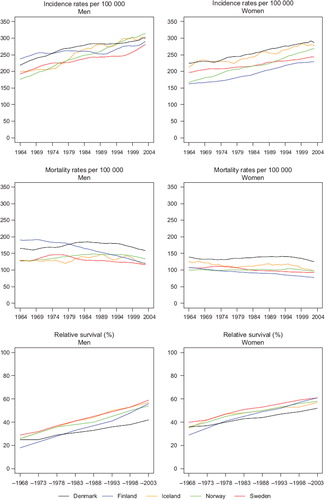
Figure 7. Trends in age-standardised (ICSS) excess deaths per 100 person years for patients of all cancer sites but non-melanoma skin, unadjusted for case-mix by sex and country. Nordic cancer survival study 1964–2003.
Table V. Trends in survival for cancer of all sites but non-melanoma skin (no case-mix adjustment) by sex and country. Number of tumours (N) included and the 5-year age-standardised (ICSS) relative survival in percent with 95% confidence intervals (RS (CI)). Nordic cancer survival study 1964–2003.
Table VI. Trends in 5-year age-specific relative survival in percent after cancer of all sites but non-melanoma skin (no case-mix adjustment) by sex and country. Nordic Cancer survival study 1964–2003.