Figures & data
Figure 1. Trends in age-standardised (World) incidence and mortality rates per 100 000 and age-standardised (ICSS) 5-year relative survival for oesophageal cancer by sex and country. Nordic cancer survival study 1964–2003.
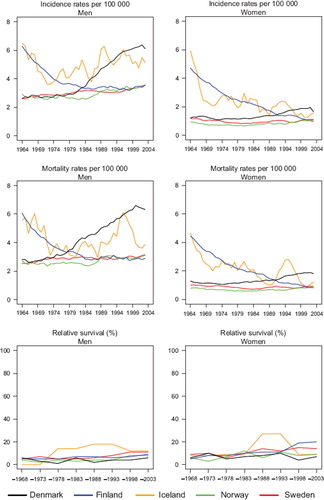
Figure 2. Trends in age-standardised (ICSS) excess death rates per 100 person years for oesophageal cancer by sex, country, and time since diagnosis. Nordic cancer survival study 1964–2003.
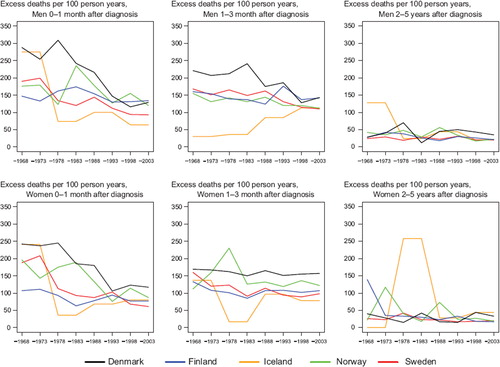
Table I. Trends in survival for oesophageal cancer by sex and country. Number of tumours (N) included and the 5-year age-standardised (ICSS) relative survival in percent with 95% confidence intervals (RS (CI)). Nordic cancer survival study 1964–2003.
Table II. Trends in 5-year age-specific relative survival in percent after oesophageal cancer by sex and country. Nordic cancer survival study 1964–2003.
Figure 3. Trends in age-standardised (World) incidence and mortality rates per 100 000 and age-standardised (ICSS) 5-year relative survival for stomach cancer by sex and country. Nordic cancer survival study 1964–2003.

Figure 4. Trends in age-standardised (ICSS) excess death rates per 100 person years for stomach cancer by sex, country, and time since diagnosis. Nordic cancer survival study 1964–2003.
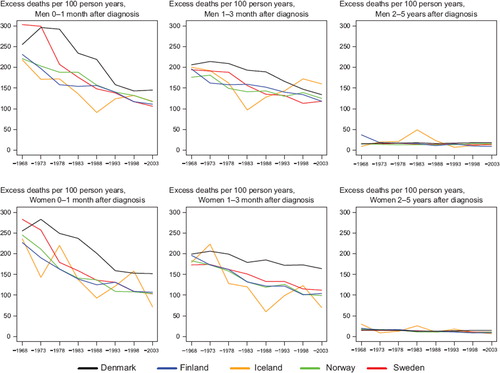
Table III. Trends in survival for stomach cancer by sex and country. Number of tumours (N) included and the 5-year age-standardised (ICSS) relative survival in percent with 95% confidence intervals (RS (CI)). Nordic cancer survival study 1964–2003.
Table IV. Trends in 5-year age-specific relative survival in percent after stomach cancer by sex and country. Nordic cancer survival study 1964–2003.
Figure 5. Trends in age-standardised (World) incidence and mortality rates per 100 000 and age-standardised (ICSS) 5-year relative survival for cancer of small intestine by sex and country. Nordic cancer survival study 1964–2003.
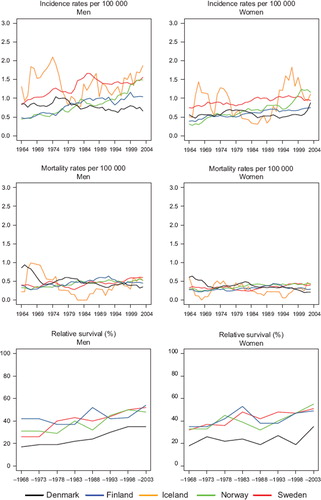
Figure 6. Trends in age-standardised (ICSS) excess death rates per 100 person years for cancer of small intestine by sex, country, and time since diagnosis. Nordic cancer survival study 1964–2003. No Icelandic curves. Too few patients to calculate survival for Iceland.
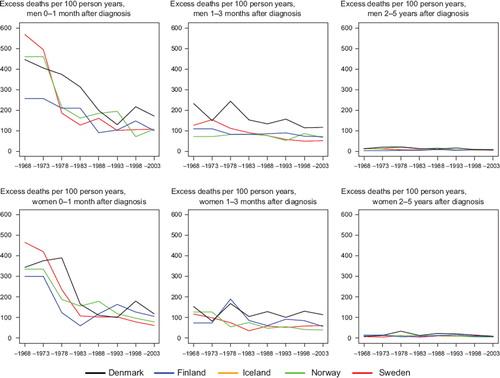
Table V. Trends in survival for cancer of small intestine by sex and country. Number of tumours (N) included and the 5-year age-standardised (ICSS) relative survival in percent with 95% confidence intervals (RS (CI)). Nordic cancer survival study 1964–2003.
Table VI. Trends in 5-year age-specific relative survival in percent after cancer of small intestine by sex and country. Nordic cancer survival study 1964–2003.
Figure 7. Trends in age-standardised (World) incidence and mortality rates per 100 000 and age-standardised (ICSS) 5-year relative survival for colon cancer by sex and country. Nordic cancer survival study 1964–2003.
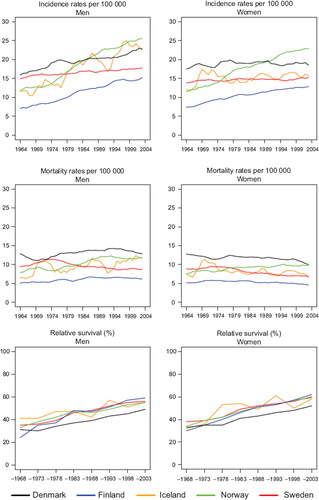
Figure 8. Trends in age-standardised (ICSS) excess death rates per 100 person years for colon cancer by sex, country, and time since diagnosis. Nordic cancer survival study 1964–2003.
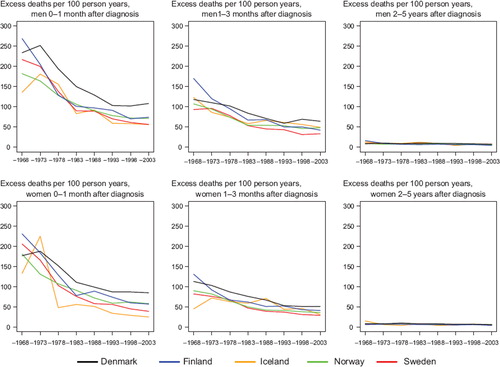
Table VII. Trends in survival for colon cancer by sex and country. Number of tumours (N) included and the 5-year age-standardised (ICSS) relative survival in percent with 95% confidence intervals (RS (CI)). Nordic cancer survival study 1964–2003.
Table VIII. Trends in 5-year age-specific relative survival in percent after colon cancer by sex and country. Nordic cancer survival study 1964–2003.
Figure 9. Trends in age-standardised (World) incidence and mortality rates per 100 000 and age-standardised (ICSS) 5-year relative survival for rectal and anal cancer by sex and country. Nordic cancer survival study 1964–2003.
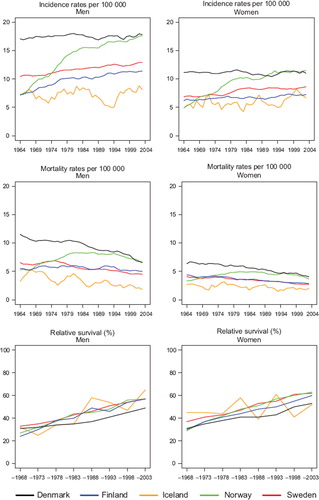
Table IX. Trends in survival for rectal and anal cancer by sex and country. Number of tumours (N) included and the 5-year age-standardised (ICSS) relative survival in percent with 95% confidence intervals (RS (CI)). Nordic cancer survival study 1964–2003.
Figure 10. Trends in age-standardised (ICSS) excess death rates per 100 person years for rectal and anal cancer by sex, country, and time since diagnosis. Nordic cancer survival study 1964–2003.
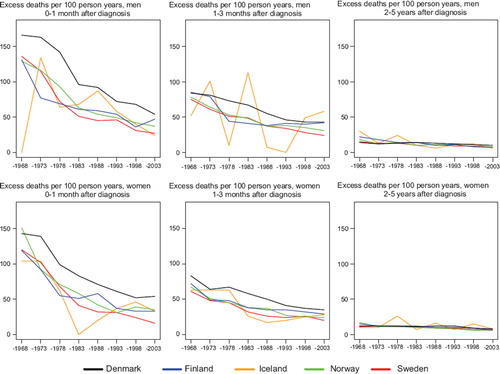
Table X. Trends in 5-year age-specific relative survival in percent after rectal and anal cancer by sex and country. Nordic cancer survival study 1964–2003.
Figure 11. Trends in age-standardised (World) incidence and mortality rates per 100 000 and age-standardised (ICSS) 5-year relative survival for liver cancer by sex and country. Nordic cancer survival study 1964–2003.
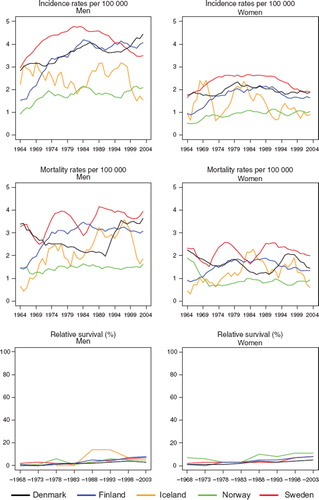
Figure 12. Trends in age-standardised (ICSS) excess death rates per 100 person years for liver cancer by sex, country, and time since diagnosis. Nordic cancer survival study 1964–2003.
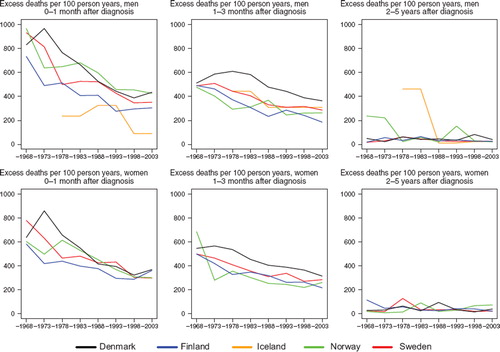
Table XI. Trends in survival for liver cancer by sex and country. Number of tumours (N) included and the 5-year age-standardised (ICSS) relative survival in percent with 95% confidence intervals (RS (CI)). Nordic cancer survival study 1964–2003.
Table XII. Trends in 5-year age-specific relative survival in percent after liver cancer by sex and country. Nordic cancer survival study 1964–2003.
Figure 13. Trends in age-standardised (World) incidence and mortality rates per 100 000 and age-standardised (ICSS) 5-year relative survival for cancer of the gallbladder and extrahepatic biliary ducts by sex and country. Nordic cancer survival study 1964–2003.
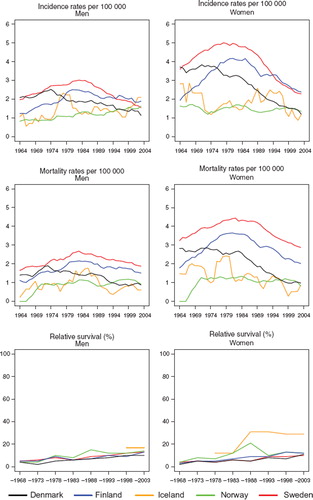
Figure 14. Trends in age-standardised (ICSS) excess death rates per 100 person years for cancer of the gallbladder and extrahepatic bilary ducts by sex, country, and time since diagnosis. Nordic cancer survival study 1964–2003.
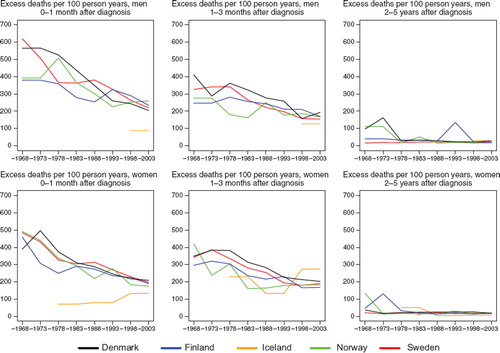
Table XIII. Trends in survival for cancer of gallbladder and extrahepatic biliary ducts by sex and country. Number of tumours (N) included and the 5-year age-standardised (ICSS) relative survival in percent with 95% confidence intervals (RS (CI)). Nordic cancer survival study 1964–2003.
Table XIV. Trends in 5-year age-specific relative survival in percent after cancer of gallbladder and extrahepatic biliary ducts by sex and country. Nordic cancer survival study 1964–2003.
Figure 15. Trends in age-standardised (World) incidence and mortality rates per 100 000 and age-standardised (ICSS) 5-year relative survival for cancer of pancreas by sex and country. Nordic cancer survival study 1964–2003.
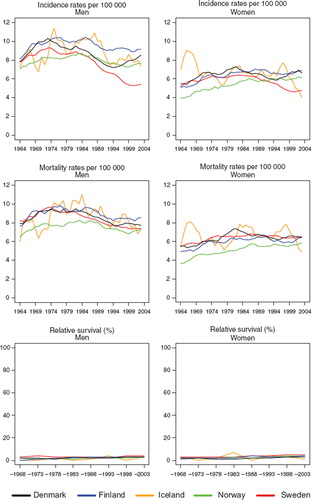
Figure 16. Trends in age-standardised (ICSS) excess death rates per 100 person years for cancer of pancreas by sex, country, and time since diagnosis. Nordic cancer survival study 1964–2003.
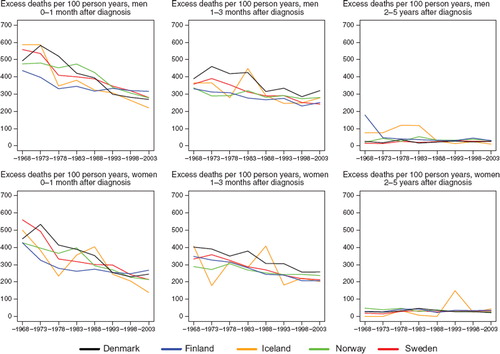
Table XV. Trends in survival for cancer of pancreas by sex and country. Number of tumours (N) included and the 5-year age-standardised (ICSS) relative survival in percent with 95% confidence intervals (RS (CI)). Nordic cancer survival study 1964–2003.
Table XVI. Trends in 5-year age-specific relative survival in percent after cancer of pancreas by sex and country. Nordic cancer survival study 1964–2003.