Figures & data
Table I. Weights (%) used in case-mix adjustment of cancer sites for 5-year relative survival for the summary groups All cancer sites but non-melanoma skin (W 1) and All cancer sites but non-melanoma skin, prostate and breas t cancer(W2) by sex. Nordic cancer survival study 1964–2003.
Figure 1. Trends in age-standardised (World) incidence and mortality rates per 100 000 and age-standardised (ICSS) 5-year relative survival for all cancer sites but non-melanoma skin (case-mix adjusted) by sex and country. Nordic cancer survival study 1964–2003.
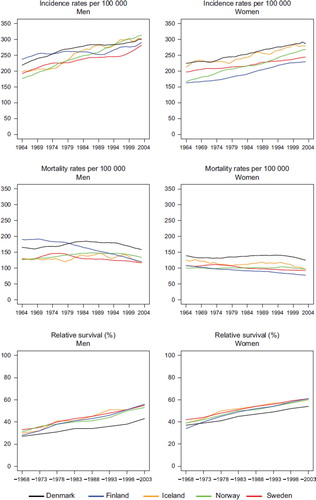
Figure 2. Trends in age-standardised (World) incidence and mortality rates per 100 000 and age-standardised (ICSS) 5-year relative survival for all cancer sites but non-melanoma skin, prostate, and breast cancer (case-mix adjusted) by sex and country. Nordic cancer survival study 1964–2003.
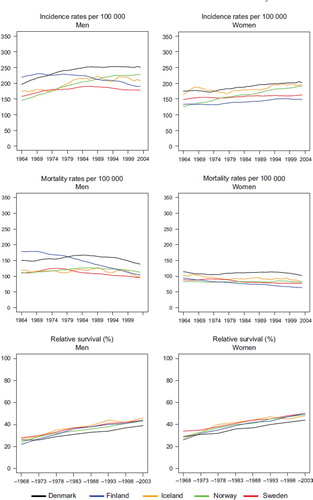
Table II. Trends in survival for all cancer sites but non-melanoma skin (case-mix adjusted) by sex and country. Number of tumours (N) included and the 5-year age-standardised (ICSS) relative survival in percent with 95% confidence intervals (RS (CI)). Nordic cancer survival study 1964–2003.
Table III. Trends in survival for all cancer sites but non-melanoma skin, prostate, and breast cancer (case-mix adjusted) by sex and country. Number of tumours (N) included and the 5-year age-standardised (ICSS) relative survival in percent with 95% confidence intervals (RS (CI)). Nordic cancer survival study 1964–2003.
Table IV. Trends in 5-year age-specific relative survival in percent after cancer of all sites but non-melanoma skin (case-mix adjusted) by sex and country. Nordic cancer survival study 1964–2003.
Table V. Trends in 5-year age-specific relative survival in percent after cancer of all sites but non-melanoma skin, prostate, and breast cancer (case-mix adjusted) by sex and country. Nordic cancer survival study 1964–2003.
Figure 3. Trends in age-standardised (ICSS) excess death rates per 100 person years for all cancer sites but non-melanoma skin (case-mix adjusted) by sex, country, and time since diagnosis in Nordic cancer survival study 1964–2003.
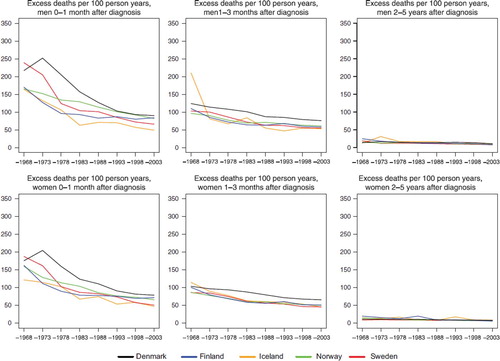
Figure 4. Trends in age-standardised (ICSS) excess death rates per 100 person years for all cancer sites but non-melanoma skin, prostate, and breast cancer (case-mix adjusted) by sex, country, and time since diagnosis in Nordic cancer survival study 1964–2003.
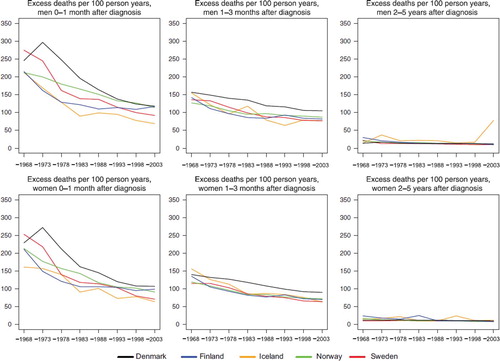
Table VI. Number of tumours (N) and 5-year age-standardised (ICSS) relative survival in percent with 95% confidence intervals (RS (CI)) with and without case-mix for the summary group all cancer sites but non-melanoma skin and for the summary group when also excluding prostate cancer among men and breast cancer among women. Patients diagnosed 1999–2003 in the Nordic countries by sex.