Figures & data
Figure 1. Coronal CT images through the central part of the tumour, with dose distribution as overlay for the seven fields and seven step-and-shoot intensity levels dose plan. Top image: 2.5 mm MLC. Middle image: 5 mm MLC. Bottom image: 10 mm MLC. Contour colours, with prescribed dose in brackets: Compartment 1: green (48.1 Gy), Compartment 2: yellow (53.8 Gy), Compartment 3: blue (63.4 Gy), Compartment 4: red (70.3 Gy).
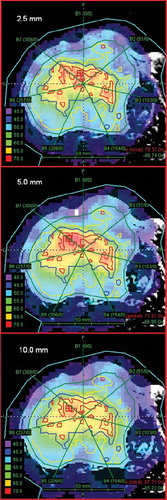
Table I. Dosimetric and radiobiological parameters for three different MLC types1.
Figure 2. Differential DVHs from the seven fields and seven step-and-shoot intensity levels dose plan. Each panel represents one compartment, and shows data for the 2.5 mm MLC (solid lines), 5 mm MLC (dashed lines) and 10 mm MLC (dotted lines).
Figure 3. TCP values for the whole tumour for the three MLC types. Each panel shows one field setup with four different step-and-shoot intensity levels.
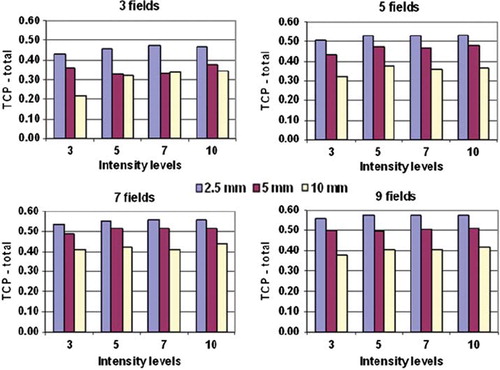
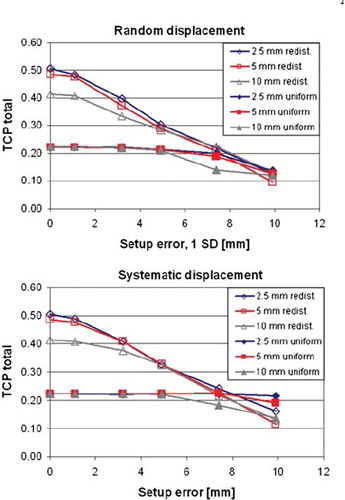
Figure 4. TCP calculations resulting from shifting the tumour relative to the dose matrix in the coronal plane. Data shown are for the seven fields and seven step-and-shoot intensity levels dose plan, with redistributed and uniform dose distributions. The abscissa for the random displacement panel (top) represents one standard deviation.